 General Curves Index General Curves Index
 Curves [A...E] Curves [A...E]
 Curves [F...P] Curves [F...P]
 Curves [P...W] Curves [P...W]
 Pear-shaped Quartic Pear-shaped Quartic
 Pearls of de Sluze Pearls of de Sluze
 Plateau Curves Plateau Curves
 Pursuit Curve Pursuit Curve
 Quadratrix of Hippias Quadratrix of Hippias
 Rhodonea Curves Rhodonea Curves
 Right Strophoid Right Strophoid
 Serpentine Serpentine
 Sinusoidal Spirals Sinusoidal Spirals
 Spiral of Archimedes Spiral of Archimedes
 Spiric Sections Spiric Sections
 Straight Line Straight Line
 Talbot's Curve Talbot's Curve
 Tractrix Tractrix
 Tricuspoid Tricuspoid
 Trident of Newton Trident of Newton
 Trifolium Trifolium
 Trisectrix of Maclaurin Trisectrix of Maclaurin
 Tschirnhaus' Cubic Tschirnhaus' Cubic
 Watt's Curve Watt's Curve
 Witch of Agnesi Witch of Agnesi
|
|
| |
Curves Index [P...W]
|
| |
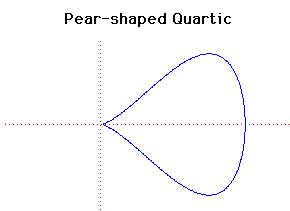
Cartesian equation:
b2y2 = x3(a-x)
|
This curve was studied by G de Longchamps in 1886.
G de Longchamps has several other curves named after him.
|
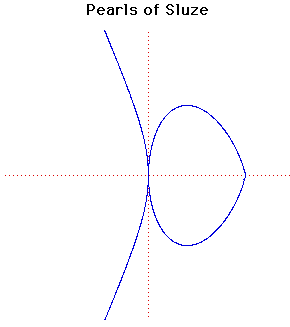
Cartesian equation:
yn = k(a - x)pxm
|
The curves with the equation given above, where n, p and m are integers, were studied by de Sluze between 1657 and 1698.
The name Pearls of Sluze was given to these curves by Blaise Pascal.
The particular curves drawn above have
n = 4, k = 2, a = 4, p = 3, m = 2.
|
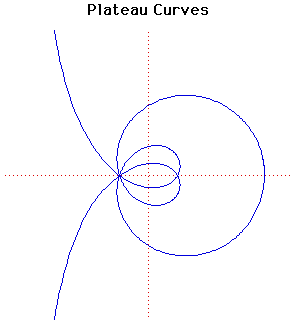
Parametric Cartesian equation:
x = a sin(m + n)t/sin(m - n)t, y = 2a sin(mt)sin(nt)/sin(m - n)t
This curve was studied by the Belgium physicist and mathematician Joseph Plateau.
If m = 2n the Plateau curves become a circle, centre (1, 0) and radius 2.
The particular curves drawn above are with the parameters m = 5, n = 3.
|
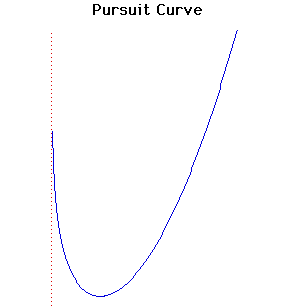
Cartesian equation:
y = cx2 - log(x)
|
If A moves along a known curve then P describes a pursuit curve if P is always directed towards A and A and P move with uniform velocities. These were considered in general by the French scientist Pierre Bouguer in 1732.
The case here is where A is on a straight line and was studied by Arthur Bernhart.
Pierre Bouguer was a French scientist who was the first to attempt to measure the density of the Earth using the deflection of a plumb line due to the attraction of a mountain. He made measurements in Peru in 1740. A more successful use of this method by the astronomer Maskelyne placed the density between 4.5 and 5.
|
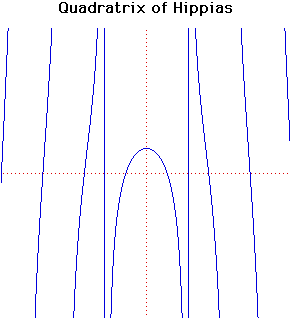
Cartesian equation:
y = x cot( x/2a) x/2a)
Polar equation:
r = 2a /( /( sin( sin( )) ))
|
The quadratrix was discovered by Hippias of Elis in 430 BC. It may have been used by him for trisecting an angle and squaring the circle. The curve may be used for dividing an angle into any number of equal parts.
Later it was studied by Dinostratus in 350 BC who used the curve to square the circle.
Hippias of Elis was a statesman and philosopher who travelled from place to place taking money for his services. Plato describes him as a vain man being both arrogant and boastful. He had a wide but superficial knowledge. His only contribution to mathematics seems to be the quadratrix.
|
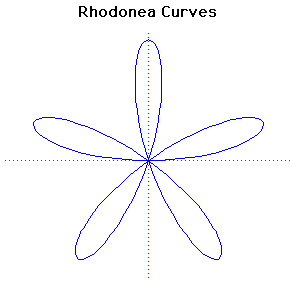
Polar equation:
r = a sin(k ) )
|
These curves were named by the Italian mathematician Guido Grandi between 1723 and 1728 because they looked like roses.
When k is an integer there are k or 2k petals depending whether k is odd or even. If k is irrational then the number of petals is infinite.
The Quadrifolium is the rhodonea curve with k = 2. It has polar equation r = a sin(2 ) and cartesian form (x2+ y2) 3 = 4 a2x2y2. ) and cartesian form (x2+ y2) 3 = 4 a2x2y2.
Luigi Guido Grandi was a member of the order of the Camaldolites. He became professor of philosophy in 1700 and professor of mathematics in 1714 both post being at the University of Pisa.
Grandi was the author of a number of works on geometry in which he considered the analogies of the circle and equilateral hyperbola. He also considered curves of double curvature on the sphere and the quadrature of parts of a spherical surface.
|
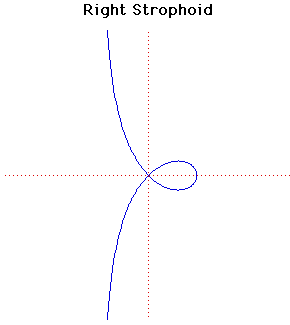
Cartesian equation:
y2 = x2(a - x)/(a + x)
Polar equation:
r = a cos(2 )/cos( )/cos( ) )
|
The strophoid first appears in work by Isaac Barrow in 1670. However Torricelli describes the curve in his letters around 1645 and Roberval found it as the locus of the focus of the conic obtained when the plane cutting the cone rotates about the tangent at its vertex.
The name (meaning a belt with a twist) was proposed by Montucci in 1846. The general strophoid has equation
r = b sin(a - 2 )/sin(a - )/sin(a -  ). ).
The particular case of a right strophoid in where a =  /2 and the equation, in cartesians and polars, is that given above. /2 and the equation, in cartesians and polars, is that given above.
The area of the loop of the right strophoid is a2(4 -  )/2 and the area between the curve and its asymptote is a2(4 - )/2 and the area between the curve and its asymptote is a2(4 -  )/2. )/2.
Let C be the circle with centre at the point where the right strophoid crosses the x-axis and radius the distance of that point from the origin. Then the strophoid is invariant under inversion in the circle C. Hence the strophoid is an anallagmatic curve.
|
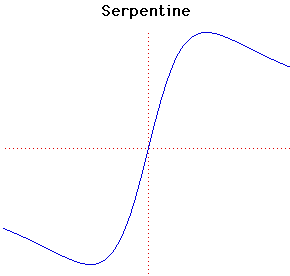
Parametric Cartesian equation:
x2y + aby - a2x = 0, ab > 0
This curve was named and studied by Newton in 1701. It is contained in his classification of cubic curves which appears in Curves by Sir Isaac Newton in Lexicon Technicumby John Harris published in London in 1710. Harris's introduction to the article states:
The incomparable Sir Isaac Newton gives this following Ennumeration of Geometrical Lines of the Third or Cubick Order; in which you have an admirable account of many Species of Curves which exceed the Conick-Sections, for they go no higher than the Quadratick or Second Order.
[Here the older spelling has been preserved including conick, Quadratick and ennumeration].
Newton shows that the curve f(x, y) = 0, where f(x, y) is a cubic, can be divided into one of four normal forms. The first of these is equations of the form
xy2 + ey = ax3 + bx2 + cx + d.
This is the hardest case in the classification and the serpentine is one of the subcases of this first normal form.
The serpentine had been studied earlier by de L'Hôpital and Huygens in 1692.
|
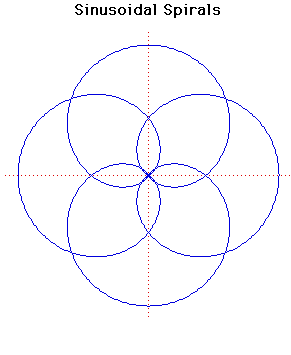
Polar equation:
rp = ap cos(p ) )
|
Sinusoidal spirals can have any rational number p in the formula above. Many standard curves occur as sinusoidal spirals.
If p = -1 we have a line.
If p = 1 we have a circle.
If p = 1/2 we have a cardioid.
If p = -1/2 we have a parabola.
If p = -2 we have a hyperbola.
If p = 2 we have a lemniscate of Bernoulli.
Sinusoidal spirals were first studied by Maclaurin.
They are not, of course, true spirals.
The pedal curve of sinusoidal spirals, when the pedal point is the pole, is another sinusoidal spiral.
The sinusoidal spiral rp = ap cos(p ) inverts to rp = ap/cos(p ) inverts to rp = ap/cos(p ) if the centre of inversion is taken at the pole. ) if the centre of inversion is taken at the pole.
|
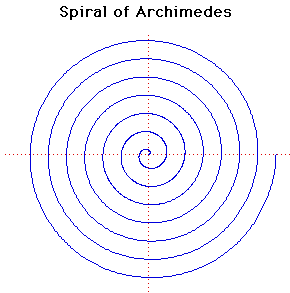
Polar equation:
r = a
|
This spiral was studied by Archimedes in about 225 BC in a work On Spirals. It had already been considered by his friend Conon.
Archimedes was able to work out the lengths of various tangents to the spiral. It can be used to trisect an angle and square the circle.
The curve can be used as a cam to convert uniform angular motion into uniform linear motion. The cam consists of one arch of the spiral above the x-axis together with its reflection in the x-axis. Rotating this with uniform angular velocity about its centre will result in uniform linear motion of the point where it crosses the y-axis.
Taking the pole as the centre of inversion, the spiral of Archimedes r = a inverts to the hyperbolic spiral r = a/ inverts to the hyperbolic spiral r = a/ . .
|
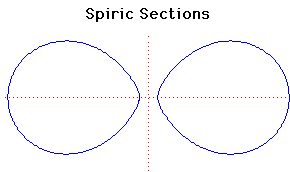
Cartesian equation:
(r2 - a2 + c2 + x2 + y2)2 = 4r2(x2 + c2)
After Menaechmus constructed conic sections by cutting a cone by a plane, around 150 BC which was 200 years later, the Greek mathematician Perseus investigated the curves obtained by cutting a torus by a plane which is parallel to the line through the centre of the hole of the torus.
In the formula of the curve given above the torus is formed from a circle of radius a whose centre is rotated along a circle of radius r. The value of c gives the distance of the cutting plane from the centre of the torus.
When c = 0 the curve consists of two circles of radius a whose centres are at (r, 0) and (-r, 0).
If c = r + a the curve consists of one point, namely the origin, while if c > r + a no point lies on the curve.
|
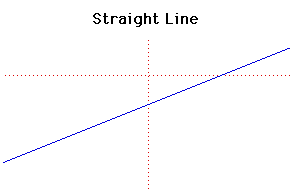
Cartesian equation:
y = mx + c
or parametrically:
x = at + b, y = ct +d
|
The straight line must be one of the earliest curves studied, but Euclid in his Elementsalthough he devotes much study to the straight line, does not consider it a curve.
In fact nobody attempted a general definition of a curve until Jordan in his Cours d'Analysein 1893.
The inverse of a straight line is a circle if the centre of inversion is not on the line.
The negative pedal of the straight line is a parabola if the pedal point is not on the line.
Since normals to a straight line never intersect and tangents coincide with the curve, evolutes, involutes and pedal curves are not too interesting.
|
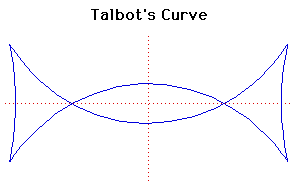
Parametric Cartesian equation:
x = (a2 + f2sin2(t))cos(t)/a, y = (a2 - 2f2 + f2sin2(t))sin(t)/b
This curve was investigated by Talbot.
Talbot's curve is the negative pedal of an ellipse with respect to its centre. It has four cusps and two nodes provided the square of the eccentricity of the ellipse is greater than 1/2.
|
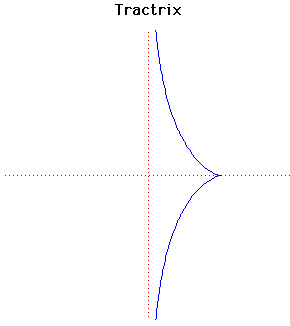
Parametric Cartesian equation:
x = 1/cosh(t), y = t - tanh(t)
The tractrix is sometimes called a tractory or equitangential curve. It was first studied by Huygens in 1692 who gave it its name. Later Leibniz, Johann Bernoulli and others studied the curve.
The study of the tractrix started with the following problem being posed to Leibniz:
What is the path of an object dragged along a horizontal plane by a string of constant length when the end of the string not joined to the object moves along a straight line in the plane?
He solved this using the fact that the axis is an asymptote to the tractrix.
The evolute of a tractrix is a catenary. Among the properties of the tractrix are the fact that the length of a tangent from its point of contact to an asymptote is constant. The area between the tractrix and its asymptote is finite.
When a tractrix is rotated around its asymptote then a pseudosphere results. This is a surface of constant negative curvature and was used by Beltrami in 1868 in his concrete realisation of non-euclidean geometry.
You can see this
surface of revolution.
|
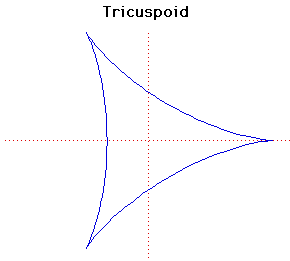
Cartesian equation:
(x2 + 2+12ax + 9a2)2 = 4a(2x + 3a)3
or parametrically:
x = a(2cos(t) + cos(2t)), y = a(2sin(t) - sin(2t))
The tricuspoid or deltoid was first considered by Euler in 1745 in connection with an optical problem. It was also investigated by Steiner in 1856 and is sometimes called Steiner's hypocycloid.
The length of the tangent to the tricuspoid, measured between the two points P, Q in which it cuts the curve again is constant and equal to 4a. If you draw tangents at P and Q they are at right angles.
The length of the curve is 16a and the area it encloses is 2 a2. a2.
In the parametric form the cusps occur at t = 0 , 2 /3 and 4 /3 and 4 /3. Notice the similarity between the parametric form of the tricuspoid and the parametric form of the cardioid. /3. Notice the similarity between the parametric form of the tricuspoid and the parametric form of the cardioid.
The pedal of the tricuspoid, where the pedal point is the cusp, is a simple folium. The pedal, where the pedal point is the vertex, is a double folium. If the pedal point is on the inscribed equilateral triangle then the pedal is a trifolium.
The caustic of the tricuspoid, where the rays are parallel and in any direction, is an astroid.
|
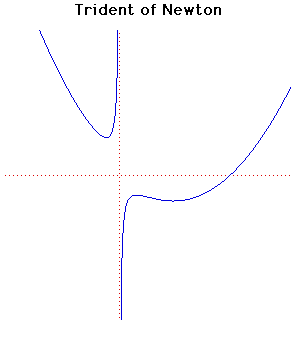
Cartesian equation:
xy = cx3 + dx2 + ex + f
|
This curve was investigated by Newton and also by Descartes. It is sometimes called the Parabola of Descartes even although it is not a parabola. The name trident is due to Newton.
The curve occurs in Newton's study of cubics. It is contained in his classification of cubic curves which appears in Curves by Sir Isaac Newtonin Lexicon Technicumby John Harris published in London in 1710.
Newton was the first to undertake such a systematic study of cubic equations and he classified them into 72 different cases. In fact he missed six cases in his classification. The trident is the 66th species in his classification and Newton gives the graph essentially looking identical to the graph given above.
Newton states some properties of his trident. For example he states that the curve has four infinite legsand that the y-axis is an asymptote to two tending towards contrary parts .He also comments And this figure is that parabola by which D. Cartes (Descartes) constructed equations of six dimensions.
Newton's classification of cubics was criticised by Euler because it lacked general general principle. Plücker later gave a more detailed classification with 219 types.
|
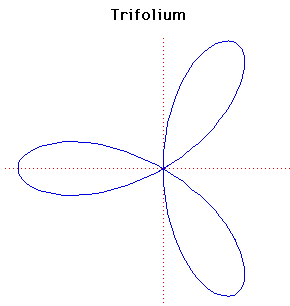
Cartesian equation:
(x2 + y2)(y2 + x(x + a)) = 4axy2
Polar equation:
r = a cos (4sin2 (4sin2 - 1) - 1)
|
The general form of the folium is given by the formula
(x2 + y2)(y2 + x(x + b)) = 4axy2
or, in polar coordinates
r = -b cos + 4a cos + 4a cos sin2 sin2 . .
The word folium means 'leaf-shaped'.
There are three special forms of the folium, the simple folium, the double folium and the trifolium. These correspond to the cases
b = 4a, b = 0, b = a
respectively in the formula for the general form.
The graph plotted above is the trifolium. There are separate entries for the simple folium and the double folium.
|
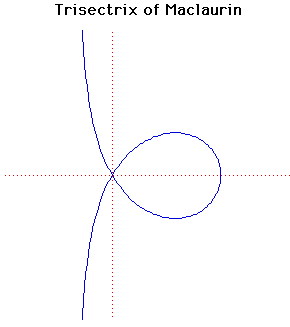
Cartesian equation:
y2(a + x) = x2(3a - x)
Polar equation:
r = 2a sin(3 )/sin(2 )/sin(2 ) )
|
This was first studied by Colin Maclaurin in 1742. Like so many curves it was studied to provide a solution to one of the ancient Greek problems, this one is in relation to the problem of trisecting an angle. The name trisectrix arises since it can be used to trisect angles.
The trisectrix of Maclaurin is an anallagmatic curve.
Another form of the equation is r = a sec( /3) where the origin is inside the loop and the crossing point is on the negative x-axis. /3) where the origin is inside the loop and the crossing point is on the negative x-axis.
The tangents to the curve at the origin make angles of  60 60 with the x-axis. with the x-axis.
The area of the loop is 3 3a2 and the distance from the origin to the point where the curve cuts the x-axis is 3a. 3a2 and the distance from the origin to the point where the curve cuts the x-axis is 3a.
It is the pedal curve of the parabola where the pedal-point is taken as the reflection of the focus in the directrix.
|
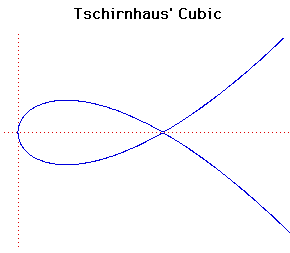
Cartesian equation: 3a y2 = x(x-a)2
|
This curve was investigated by Tschirnhaus, de L'Hôpital and Catalan. As well as Tschirnhaus' cubic it is sometimes called de L'Hôpital's cubic or the trisectrix of Catalan.
The name Tschirnhaus's cubic is given in R C Archibald's paper written in 1900 where he attempted to classify curves.
Tschirnhaus's cubic is the negative pedal of a parabola with respect to the focus of the parabola.
The caustic of Tschirnhaus's cubic where the radiant point is the pole is Neile's semi-cubic parabola .
|
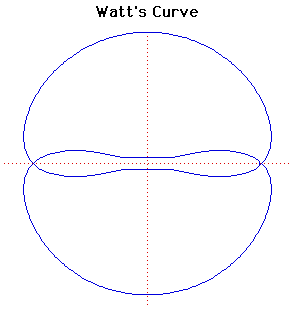
Polar equation:
r2 = b2 - [a sin( ) )   (c2 - a2cos2( (c2 - a2cos2( ))]2 ))]2
|
The curve is named after James Watt (1736- 1819), the Scottish engineer who developed the steam engine. In fact the curve comes from the linkages of rods connecting two wheels of equal diameter.
Let two wheels of radius b have their centres 2a apart. Suppose that a rod of length 2c is fixed at each end to the circumference of the two wheels. Let P be the mid-point of the rod. Then Watt's curve C is the locus of P.
If a = c then C is a circle of radius b with a figure of eight inside it.
Sylvester, Kempe and Cayley further developed the geometry associated with the theory of linkages in the 1870's. In fact Kempe proved that every finite segment of an algebraic curve can be generated can be generated by a linkage in this way.
|
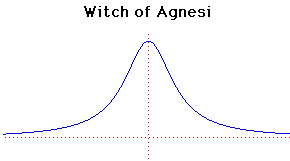
Cartesian equation:
y(x2 + a2) = a3
or parametrically:
x = at, y = a/(1 + t2)
This was studied and named versiera by Maria Agnesi in 1748 in her book Istituzioni Analitiche. It is also known as Cubique d'Agnesi or Agnésienne. There is a discussion on how it came to be called witch in Agnesi's biography.
The curve had been studied earlier by Fermat and Guido Grandi in 1703.
The curve lies between y = 0 and y = a. It has points of inflection at y = 3a/4. The line y = 0 is an asymptote to the curve.
The curve can be considered as the locus of a point P defined as follows. Draw a circle C with centre at (0, a/2) through O. Draw a line from O cutting C at L and the line y = a at M. Then P has the x-coordinate of M and the y-coordinate of L.
The tangent to the Witch of Agnesi at the point with parameter p is
(p2+1)2y + 2px = a(3p2+1).
|
|
|


