 General Curves Index General Curves Index
 Curves [A...E] Curves [A...E]
 Curves [F...P] Curves [F...P]
 Curves [P...W] Curves [P...W]
 Fermat's Spiral Fermat's Spiral
 Folium Folium
 Folium of Descartes Folium of Descartes
 Freeth's Nephroid Freeth's Nephroid
 Frequency Curve Frequency Curve
 Hyperbola Hyperbola
 Hyperbolic Spiral Hyperbolic Spiral
 Hypocycloid Hypocycloid
 Hypotrochoid Hypotrochoid
 Involute of a Circle Involute of a Circle
 Kampyle of Eudoxus Kampyle of Eudoxus
 Kappa Curve Kappa Curve
 Lamé Curves Lamé Curves
 Lemniscate of Bernoulli Lemniscate of Bernoulli
 Limacon of Pascal Limacon of Pascal
 Lissajous Curves Lissajous Curves
 Lituus Lituus
 Neile's Parabola Neile's Parabola
 Nephroid Nephroid
 Newton's Parabolas Newton's Parabolas
 Parabola Parabola
|
|
| |
Curves Index [F...P]
|
| |
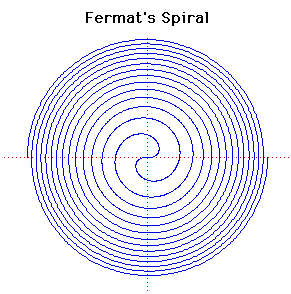
Polar equation: r2 =
a2
|
This spiral was discussed by Fermat
in 1636.
For any given positive value of  there are two corresponding values of r, one being the negative of the
other. The resulting spiral will therefore be symmetrical about the line
y = -x as can be seen from the curve displayed on the left.
The inverse of Fermat's
Spiral, when the pole is taken as the centre of inversion, is the spiral
r2 = a2/ . .
For technical reasons with the plotting routines, when evolutes, involutes,
inverses and pedals are drawn only one of the two branches of the spiral are
drawn.
|

Cartesian equation: (x2 +
y2)(y2 + x(x + b)) =
4axy2
Polar equation: r = -b cos
 + 4a cos + 4a cos
 sin2 sin2

The general form of the folium is given by the formula above. The word
folium means leaf-shaped.
There are three special forms of the folium, the simple folium, the
double
folium and the trifolium.
These correspond to the cases
b = 4a, b = 0, b = a
respectively in the formula above.
The graph plotted above is the simple folium. There are separate entries for
the double
folium and the trifolium.
The simple folium is the pedal curve of the
tricuspoid
where the pedal point is one of the cusps.
|
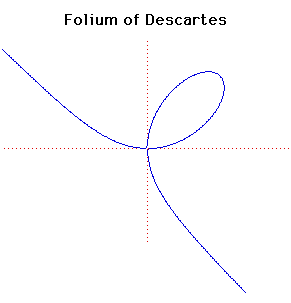
Cartesian equation: x3 +
y3 = 3axy
or parametrically: x = 3at/(1 +
t3), y = 3at2/(1 +
t3)
This folium was first discussed by
Descartes
in 1638 but, although he found the correct shape of the curve in the positive
quadrant, he believed that this leaf shape was repeated in each quadrant like
the four petals of a flower.
The problem to determine the tangent to the curve was proposed to
Roberval
who also wrongly believed the curve had the form of a jasmine flower. His name
of fleur de jasminwas later changed.
The curve is sometimes known as the noeud de ruban.
The folium has an asymptote x + y + a = 0.
The equation of the tangent at the point with t = p is
p(p3 - 2)x + (1 -
2p3)y + 3ap2 = 0. The
curve passes through the origin at t = 0 and approaches the origin a
second time as t goes to infinity.
|

Polar equation:
r = a(1 + 2sin( /2)) /2))
This is a strophoid of a circle with the pole O at the centre of the circle and the fixed point P on the circumference of the circle.
In the picture above, O is the origin and P is the node where the curve crosses itself three times.
If the line through P parallel to the y-axis cuts the nephroid at A then angle AOP is 3
 /7. This can be used to construct a regular 7 sided figure. /7. This can be used to construct a regular 7 sided figure.
T J Freeth (1819-1904) was an English mathematician. In a paper published by the London Mathematical Society
in 1879 he described various strophoids, including the strophoid of a
trisectrix.
|
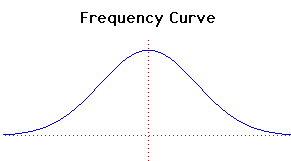
Cartesian equation:
y =  (2 (2 ) exp(-x2/2) ) exp(-x2/2)
This curve, the normal curve of error, originated with de Moivre in 1733. It was also studied with
Laplace and Gauss.
The name frequency curve also applies to a great variety of other curves.
|

Cartesian equation:
x2/a2 - y2/b2 = 1
or parametrically:
x = a sec(t), y = b tan(t)
A special case of the hyperbola was first studied by
Menaechmus. This special case was xy = ab where the asymptotes are at right angles and
this particular form of the hyperbola is called a rectangular hyperbola.
Euclid and Aristaeus
wrote about the general hyperbola but only studied one branch of it while the hyperbola was given its present name by
Apollonius who was the first to study the two branches of the hyperbola.
The focus and directrix of a hyperbola were considered by Pappus.
The pedal curve of a hyperbola with its focus as pedal point is a circle. The pedal of a rectangular hyperbola with
its centre as pedal point is a lemniscate.
The evolute of the hyperbola with equation given above is the Lamé curve
(ax)2/3 - (by)2/3 = (a + b)2/3.
From a point between the two branches of the evolute two normals can be drawn to the hyperbola but from a
point beyond the evolute four normals can be drawn.
If the centre of a rectangular hyperbola is taken as the centre of inversion, the rectangular hyperbola inverts to a
lemniscate.
If the vertex of a rectangular hyperbola is taken as the centre of inversion, the rectangular hyperbola inverts to a
right strophoid. If the focus of a hyperbola is taken as the centre of inversion, the hyperbola inverts to a
limacon. In this last case if the asymptotes of the hyperbola make an angle of
 /3 with the axis which cuts the hyperbola then it inverts to a
Trisectrix of Maclaurin. /3 with the axis which cuts the hyperbola then it inverts to a
Trisectrix of Maclaurin.
|

Polar equation:
r = a/
|
The hyperbolic spiral originated with Pierre Varignon in 1704.
It was studied by Johann Bernoulli between 1710 and 1713 and it was also studied by
Cotes in 1722.
The roulette of the pole of a hyperbolic spiral rolling on a straight line is a
tractrix.
Pierre Varignon (1654-1722) was professor of mathematics at
Collège Mazarin and later at Collège Royal. Led into mathematics by reading
Euclid he also read
Descartes' Géométrieand thereafter devoted himself to the mathematical sciences.
He was one of the first French scholars to recognise the value of the calculus. His chief contributions were
to mechanics.
Taking the pole as the centre of inversion, the hyperbolic spiral r = a/ inverts to the spiral of
Archimedes r = a inverts to the spiral of
Archimedes r = a . .
|

Parametric Cartesian equation:
x = (a - b) cos(t) + b cos((a/b - 1)t),
y = (a - b) sin(t) - b sin((a/b - 1)t)
There are four curves which are closely related. These are the epicycloid,
the epitrochoid, the hypocycloid and the
hypotrochoid and they are traced by a point P on a circle of radius b
which rolls round a fixed circle of radius a.
For the hypocycloid, an example of which is shown above, the circle of radius b rolls on the inside
of the circle of radius a. The point P is on the circumference of the circle of radius b. For the example a = 5 and b = 3.
These curves were studied by Dürer (1525),
Desargues (1640), Huygens (1679), Leibniz, Newton (1686),
de L'Hôpital (1690),
Jacob Bernoulli (1690), la Hire (1694), Johann Bernoulli
(1695), Daniel Bernoulli (1725),
Euler (1745, 1781).
Special cases are a = 3b when a tricuspoid is obtained and a = 4b when an astroid is obtained.
If a = (n + 1)b where n is an integer, then the length of the epicycloid is 8nb and its area is  b2(n2 - n). b2(n2 - n).
The pedal curve, when the pedal point is the centre, is a rhodonea curve.
The evolute of a hypocycloid is a similar hypocycloid - look at the evolute of the hypocycloid above to see it is a similar hypocycloid but smaller in size.
|

Parametric Cartesian equation:
x = (a - b) cos(t) + c cos((a/b -1)t), y = (a - b) sin(t) - c sin((a/b -1)t)
There are four curves which are closely related. These are the epicycloid,
the epitrochoid, the hypocycloid and the hypotrochoid and they are traced
by a point P on a circle of radius b which rolls round a fixed circle of radius a.
For the hypotrochoid, an example of which is shown above, the circle of radius b rolls on the inside
of the circle of radius a. The point P is at distance c from the centre of the circle
of radius b. For this example a = 5, b = 7 and c = 2.2.
These curves were studied by la Hire,
Desargues, Leibniz,
Newton and many others.
|

Parametric Cartesian equation:
x = a(cos(t) + t sin(t)), y = a(sin(t) - t cos(t))
The involute of a circle is the path traced out by a point on a straight line that rolls around a circle.
It was studied by Huygens when he was considering clocks without
pendulums that might be used on ships at sea. He used the involute of a circle in his first pendulum clock
in an attempt to force the pendulum to swing in the path of a cycloid.
Finding a clock which would keep accurate time at sea was a major problem and many years were spent looking
for a solution. The problem was of vital importance since if GMT was known from a clock then, since local
time could be easily computed from the Sun, longitude could be easily computed.
The pedal of the involute of a circle, with the centre as pedal point, is a Spiral of Archimedes.
Of course the evolute of an involute of a circle is a circle.
|

Cartesian equation:
a2x4 = b4(x2 + y2)
Polar equation:
r = b2/(a cos2( )) ))
A curve studied by Eudoxus also in relation to the classical problem of duplication of the cube.
Eudoxus was a pupil of Plato. His main work was in astronomy. He was the first to describe the constellations and invented the astrolabe. He introduced the study of mathematical astronomy into Greece.
Eudoxus found formulas for measuring pyramids cones and cylinders. His work contains elements of the calculus with a rigorous study of the method of exhaustion.
|

Cartesian equation:
y2(x2 + y2) = a2x2
Polar equation: r = a cot( ) )
|
The kappa curve is also called Gutschoven's curve. It was first studied by G. van Gutschoven around 1662.
The curve was studied by Newton and, some years later, by Johann Bernoulli.
|

Cartesian equation:
(x/a)n + (y/b)n = 1
|
In 1818 Lamé discussed the curves with equation given above. He considered more general curves than just those where n is an integer. If n is a rational then the curve is algebraic but, for irrational n, the curve is transcendental.
The curve drawn above is the case n = 4. For even integers n the curve becomes closer to a rectangle as n increases. For odd integer values of n the curve looks like the even case in the positive quadrant but goes to infinity in both the second and fourth quadrants.
The case n = 2/3 is the Astroid, while the case n = 3 is the (so-called) Witch of Agnesi.
The case n = 5/2 has been associated with the Danish architect and poet Piet Hein (inventor of the Soma Cube) under the name of superellipse and have been used for a variety of purposes, including motorway bridges and other architectural applications.
|
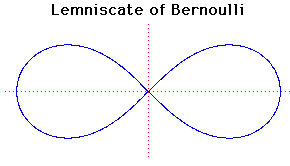
Cartesian equation:
(x2 + y2)2 = a2(x2 - y2)
Polar equation:
r2 = a2cos(2 ) )
|
In 1694 Jacob Bernoulli published an article in Acta Eruditorumon a curve
shaped like a figure 8, or a knot, or the bow of a ribbon
which he called by the Latin word lemniscus ('a pendant ribbon').
Jacob Bernoulli was not aware that the curve he was
describing was a special case of a Cassinian Oval which had been described by
Cassini in 1680.
The general properties of the lemniscate were discovered by Giovanni Fagnano in 1750.
Euler's investigations of the length of arc of the curve (1751) led to later work on elliptic functions.
Inverting the lemniscate in a circle centred at the origin and touching the lemniscate where it crosses the x-axis produces a rectangular hyperbola.
The bipolar equation of the lemniscate is rr' = a2/2.
|
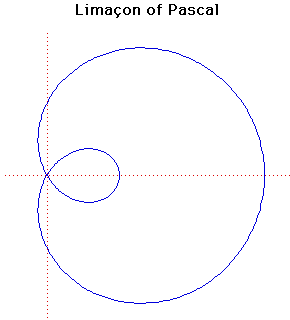
Cartesian equation:
(x2 + y2 - 2ax)2 = b2(x2 + y2)
Polar equation:
r = b + 2a cos( ) )
Limacon of Pascal was discovered by Étienne Pascal (father of Blaise Pascal) and named by another Frenchman Gilles-Personne
Roberval in 1650 when he used it as an example of his methods of drawing tangents i.e. differentiation.
The name 'limacon' comes from the Latin limax meaning 'a snail'. Étienne Pascal corresponded with Mersenne whose house was a meeting place for famous geometers including
Roberval.
Dürer should really be given the credit for discovering the curve since he gave a method for drawing the limacon, although he did not call it a limacon, in Underweysung der Messungpublished in 1525.
When b = 2a then the limacon becomes a cardioid while if b = a then it becomes a trisectrix. Notice that this trisectrix is not the Trisectrix of
Maclaurin.
If b  2a then the area of the limacon is (2a2 + k2) 2a then the area of the limacon is (2a2 + k2) . If b = a (the case drawn above with a = b = 1) then the area of the inner loop is a2( . If b = a (the case drawn above with a = b = 1) then the area of the inner loop is a2( - 3 - 3
 3/2) and the area between the loops is a2
( 3/2) and the area between the loops is a2
( + 3 + 3 3). 3).
The limacon is an anallagmatic curve.
The limacon is also the catacaustic of a circle when the light rays come from a point a finite (non-zero) distance from the circumference. This was shown by Thomas de St Laurent in 1826.
|

Parametric Cartesian equation:
x = a sin(nt + c), y = b sin(t)
|
Lissajous
curves or Lissajous
figures are sometimes called Bowditch curves after Nathaniel Bowditch
who considered them in 1815. They were studied in more detail (independently) by
Jules-Antoine Lissajous in 1857.
Lissajous
curves have applications in physics, astronomy and other sciences.
Nathaniel Bowditch
(1773-1838) was an American. He learnt Latin to study Newton's
Principiaand later other languages to study mathematics in these
languages. His New American Practical Navigator(1802) and his translation
of Laplace's
Mécanique célestegave him an international reputation.
|

Polar equation:
r2 = a2/
|
The lituus curve originated with Cotes in 1722. Lituus means a crook,
for example a bishop's crosier. Maclaurin used the term in his book Harmonia Mensurarumin 1722.
The lituus is the locus of the point P moving in such a manner that the area of a circular sector remains constant.
Roger Cotes (1682-1716) died at the age of 34 having only published two memoirs during his lifetime.
Appointed professor at Cambridge at the age of 24 his work was published only after his death.
Cotes discovered an important theorem on the nth roots of unity; anticipated the method of least squares and discovered a method of integrating rational fractions with binomial denominators.
|

Cartesian equation:
y3 = a x2
|
This curve, sometimes called the semi-cubical parabola, was discovered by William Neile in 1657. It was the first algebraic curve to have its arc length computed. Wallis published the method in 1659 giving Neile the credit. The Dutch writer Van Heuraet used the curve for a more general construction.
William Neile was born at Bishopsthrope in 1637. He was a pupil of Wallis and showed great promise. Neile's parabola was the first algebraic curve to have its arc length calculated; only the arc lengths of transcendental curves such as the cycloid and the logarithmic spiral had been calculated before this. Unfortunately Neile died at a young age in 1670 before he had achieved many further results.
In 1687 Leibniz asked for the curve along which a particle may descend under gravity so that it moves equal vertical distances in equal times. Huygens showed that the semi-cubical parabola x3 = ay2 satisfied this property. Because of this it is an isochronous curve.
The semi-cubical parabola is the evolute of a parabola.
|
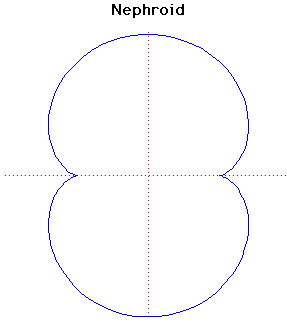
Parametric Cartesian equation:
x = a(3cos(t) - cos(3t)), y = a(3sin(t) - sin(3t))
|
The name nephroid (meaning 'kidney shaped') was used for the two-cusped epicycloid by Proctor in 1878. The nephroid is the epicycloid formed by a circle of radius a rolling externally on a fixed circle of radius 2a.
The nephroid has length 24a and area 12 2. 2.
Huygens, in 1678, showed that the nephroid is the catacaustic of a circle when the light source is at infinity. He published this in Traité de la lumièrein 1690. An explanation of why this should be was not discovered until the wave theory of light was used. Airy produced the theoretical proof in 1838.
R A Proctor was an English mathematician. He was born in 1837 and died in 1888. In 1878 he published The geometry of cycloidsin London.
The involute of the nephroid is Cayley's sextic or another nephroid since they are parallel curves. To see the nephroid as an involute of itself see Involute 2 above constructing the involute through the point where the nephroid cuts the y-axis.
|

Cartesian equation:
ay2 = x(x2 - 2bx + c), a > 0
|
Newton's classification of cubic curves appears in Curves by Sir Isaac Newton in Lexicon Technicum by John Harris published in London in 1710. In this classification of cubics, Newton gives four classes of equation. The third class of equations is the one given above which Newton divides into five species. Of this third case Newton says:
In the third Case the Equation was yy = ax3 + bxx + cx + d and defines a Parabola whose Legs diverge from one another, and run out infinitely contrary ways.
The case divides into five species and Newton gives a typical graph for each species. The five types depend on the roots of the cubic in x on the right hand side of the equation.
(i) All the roots are real and unequal : then the Figure is a diverging Parabola of the Form of a Bell, with an Oval at its vertex .
This is the case for the graph drawn above.
(ii) Two of the roots are equal : a Parabola will be formed, either Nodated by touching an Oval, or Punctate, by having the Oval infinitely small .
(iii) The three roots are equal : this is the Neilian Parabola, commonly called Semi-cubical .
(iv) Only one real root : If two of the roots are impossible, there will be a Pure Parabola of a Bell-like Form .
|
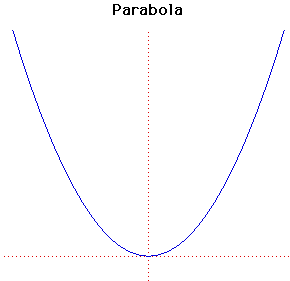
Cartesian equation:
y = ax2 + bx + c
The parabola was studied by Menaechmus who was a pupil of Plato and Eudoxus. He attempted to duplicate the cube, namely to find side of a cube that has area double that of a given cube. Hence he attempted to solve x3 = 2 by geometrical methods.
In fact the geometrical methods of ruler and compass constructions cannot solve this (but Menaechmus did not know this). Menaechmus solved it by finding the intersection of the two parabolas x2 = y and y2 = 2x.
Euclid wrote about the parabola and it was given its present name by Apollonius. The focus and directrix of a parabola were considered by Pappus.
Pascal considered the parabola as a projection of a circle and Galileo showed that projectiles follow parabolic paths.
Gregory and Newton considered the properties of a parabola which bring parallel rays of light to a focus.
The pedal of the parabola with its vertex as pedal point is a cissoid. The pedal of the parabola with its focus as pedal point is a straight line. With the foot of the directrix as pedal point it is a right strophoid (an oblique strophoid for any other point of the directrix). The pedal curve when the pedal point is the image of the focus in the directrix is a Trisectrix of Maclaurin.
The evolute of the parabola is Neile's parabola. From a point above the evolute three normals can be drawn to the parabola, while only one normal can be drawn to the parabola from a point below the evolute.
If the focus of the parabola is taken as the centre of inversion, the parabola inverts to a cardioid. If the vertex of the parabola is taken as the centre of inversion, the parabola inverts to a Cissoid of Diocles.
The caustic of the parabola with the rays perpendicular to the axis of the parabola is Tschirnhaus's Cubic.
|
|
|


