VIS & NIR Diode Laser Molecular Spectroscopy
Consiglio Nazionale delle Ricerche - Area della Ricerca di Pisa - Italy


by A. Lucchesini


Keywords: Tunable diode-laser spectrometers; Overtone bands; Overtone absorption spectroscopy; Molecular spectroscopy; Line and band widths, shapes and shifts; Modulation broadening; VIS-IR spectrometers; Auxiliary equipment and techniques; Infrared spectra.

Details


The double heterostructure diode lasers (DLs) have become the cheapest monochromatic sources in the field of the atomic and molecular spectroscopy.
Commercially available AlGaAs and InGaAlP DLs emissions can be easily tuned and scanned around most of the ro-vibrational overtone absorptions of molecules like CH4, CH3Cl, CH3F, CH3I, C2H2, C2H4, CO2, HCl, HCN, HDO, HF, H2O, NH3, NO2, N2O, O2, O3, etc.. Unfortunately these transition lines are weak and therefore noise-reduction techniques must be used.

The frequency modulation (FM) technique can be applied to DLs by playing with their injection current. When the frequency of the modulation is chosen much lower than the resonance line-width, the FM spectroscopy is usually called wavelength modulation (WM) spectroscopy.

Overtone absorption resonances have been successfully observed by using AlGaAs diode lasers with WM spectroscopy and harmonic detection techniques.
The WM technique, applied to coherent sources like DLs, permits to reach good sensitivities per unit of optical path-length even for very weak lines such as the oxygen electric dipole forbidden ones. Since a diode laser apparatus is much cheaper than either the dye laser based one and the high resolution Fourier transform spectrometer, in practice it enables any research laboratory to do high resolution spectroscopy.


Experimental apparatus.


Sketch of the apparatus

BS: beam-splitter; D: photo-diode; F.- P.: Fabry-Perót interferometer; M: monochromator; OI: optical insulator; TDL: tunable diode laser.


WM spectroscopy techniques are currently adopted for pressure broadening and shifting measurements.
The experimental apparatus consists of a single mode both transversely and longitudinally diode laser. The current is driven by a stabilized low-noise current generator, which permits also the scan of the emission wavelength by mixing to the driving current an attenuated low frequency (~1 Hz) sawtooth signal. The DL is temperature regulated within 0.002 K by a Peltier junction driven by a high stability temperature controller.
The diode laser emission wavelength shows a strong and linear temperature dependence (~0.2 nm/K): one of the major requirements, when using these sources for spectroscopy, is the very good temperature stabilization. The mode hops are the major DL drawback in free-running mode, which is the simplest and cheapest way to operate. The current dependence for small variations can be considered linear too, with a dependence of about 0.01 nm/mA. The measurement cell is a multipass Herriott type one, 50 cm long and 7 cm diameter. The total optical path length is 30 m. A confocal 5 cm Fabry-Perót interferometer is adopted to mark the frequency scan and to check the goodness of the DL emission. A 350 mm focal length monochromator is employed for the rough wavelength reading.
For line-shift measurements, a cell filled with a gas at fixed pressure is adopted as a reference. In case of oxygen, an open path is adopted, taking into account the atmospheric oxygen partial pressure. Silicon photodiodes collect the transmitted signals.
For the phase detection a sinusoidal modulation at a frequency of 10 kHz is added to the DL injection current. The transmitted power is collected by the photodiodes and sent to the lock-in amplifiers in order to extract the second harmonic signals. The resulting second derivative of the absorption feature has a very good signal to noise ratio and a flat baseline, as it can be seen in the following figures.


Some experimental results.


Example of absorption spectrum: oxygen

Second derivative of the molecular oxygen absorption spectrum at ~759 nm along with the inverted transmission of the monochromator centered to the RQ(19) (13160.813 cm-1) line. The measurement has been done at room temperature with an oxygen pressure of 20 Torr, through an optical path length of 3 m and by using a 2.5 ms time constant. [ See A. Lucchesini, M. De Rosa, C. Gabbanini and S. Gozzini, "Diode laser spectroscopy of oxygen electronic band at 760 nm", Nuovo Cimento D 20(3), 253 (1998)]

The knowledge of the pressure induced broadening and shifting coefficients can be important in the atmospheric analysis, especially for constructing spectroscopical maps of the planets. Moreover, the knowledge of these parameters is important also to better understand the intermolecular interactions.


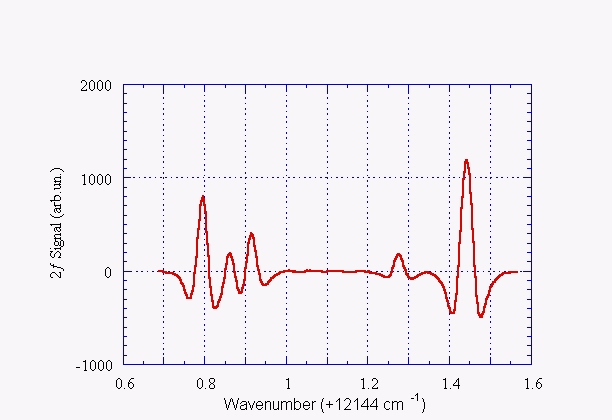
Another example of absorption spectrum: water vapor

Second derivative of the water vapor absorption spectrum at ~823 nm (~13145 cm-1). The measurement has been done at room temperature with a water vapor pressure of 20 Torr, through an optical path length of 5 m and by using a 2.5 ms time constant. The line positions agree with what listed by HITRAN database within 0.01 cm-1: 12144.795, 12144.862, 12144.915, 12145.279 e 12145.444 cm-1 respectively.

The excellent resolving power of the spectroscopic apparatus potentially permits to discriminate different gases in a complex atmosphere, with response times of the order of 10−100 milliseconds. Sensitivity of tens of p.p.m. per meter of path has been obtained with molecular oxygen, as well as with water vapor, ammonia and acetylene.
The following image shows two ammonia absorption lines, the position of which is only known for one of them.


Ammonia absorptions at 788 nm

Second derivative of two ammonia absorption lines at 788.8 nm (~12673 cm-1). The measurement has been done at room temperature with 18 Torr of ammonia, through an optical path length of 5 m and by using a time constant of 12.5 ms. Only one line position is well known (12673.72 cm-1). The other differs from this by 0.072 cm-1.
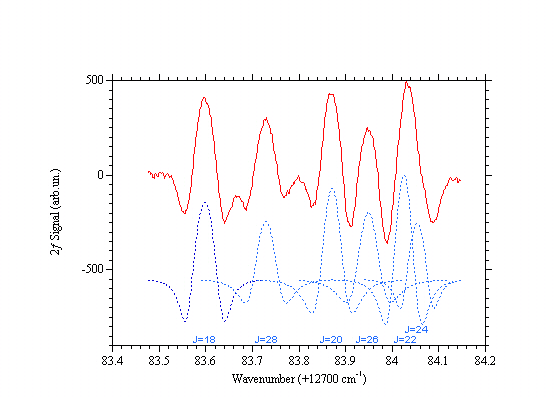
The last example concerns the WMS of 91 Torr of carbon dioxide at 782 nm. The linewidths are larger than the Voigt profile would justify at this pressure; this is due to the large modulation amplitude needed by the very low absorption cross sections (~5 x 10-26 cm2/molecule). This figure is emblematic of the resolving power of the laser diode spectrometer.

Carbon dioxide absorption lines around 782 nm

Second derivative of the carbon dioxide absorption spectrum at ~782nm. The measurement has been done at room temperature, CO2 pressure = 91 Torr, through 30 m optical path length and 10 Hz bandwidth. This is the R branch at the "turning point". The regression of the value of J is due to the reduction of the constant B as the ro-vibrational energy increases. [ See A. Lucchesini, S. Gozzini, "Diode laser overtone spectroscopy of CO2 at 780 nm", J. Quant. Spectrosc. Radiat. Transfer 96(2), 289-299 (2005)]


For the "Two Tone Frequency Modulation Spectroscopy" technique (TTFM) see the work for the Thesis Degree: "Spettroscopia di Gas Mediante Laser a Diodo Modulati in Frequenza" by D. Pelliccia. (ITA, compressed, 1.84 MB)


Abstracts

Presentations

List of molecular absorptions interesting from the environmental view-point (92 kB, it needs Acrobat Reader®)

Preprints

Observed and measured molecular absorption lines with maximum energy position error 0.01 cm-1:
CH4, CH3Cl, CH3F, CH3I, C2H4, CO2, HDO, NH3 and N2O.

Other interesting works are the diode laser spectroscopy of atomic oxygen,

the saturation spectroscopy of potassium,

the N2O detection by the Gas Filter Correlation (GFC) technique using a mid-infrared light emitting diode (ENG, Adobe Acrobat®: 458 kB)

and the Light-Induced Drift of rubidium.


Interesting Links


Alessandro Lucchesini
CNR - INO
Area della Ricerca
Via Giuseppe Moruzzi, 1
56124 Pisa ITALY
Skype: alessandro.lucchesini


Last updated on July the 1st, 2024.