
|
|
|
| Last update: 25-08-2009 |
|
|
|
|
||||||||||||||||||||||||||||||||||||||||||||||||||||||||||||||||||||||||||||||||
|
|
||||||||||||||||||||||||||||||||||||||||||||||||||||||||||||||||||||||||||||||||
|
Watch us on Euronews :
If you want to watch the video in your languange go to euronews link: http://www.euronews.net/en/article/30/10/2008/student-projects-fly-high-in-northern-sweden/
Our experiment was switched on at 5:52:25 UTC , approximately 1 hour and 18 minutes before Bexus 6 launch occurred at 7:10 UTC. We experienced few minutes of panic 30 minutes before launch due to the loss of telemetry. However LowCoINS was still working correctly, it was E-link that was switched off! We had the opportunity to follow the flight through the telemetry and a preliminary check of the data received during the flight shows the experiment worked well. The thermal control also worked correctly, the experiment internal temperature never fell below 12 °C, and there was no need for the heater to go on. A short time before landing, when the balloon was at at 1838 m, we lost the E-link connection. It happens at 10:16 UTC. Before loosing the telemetry, we decided to send the TC to change the temperature thresholds, so that the heater would be switched on between 3-5 °C instead of 10-12 °C. In this way, we preserved the battery consumption to maintain the thermal control for the experiment as long as possible before the recovery.
A preliminary analysis of our data shows some interesting aspect of the flight. An almost continuous oscillatory movement of the gondola around the vertical axis was recorded by the Z axis gyroscope.
Two important moment of the Bexus 6 flight has been recorded by the experiment:
The readings from the z axis accelerometer show the exact moment of the cut-down, it can be noticed that the acceleration goes suddenly to zero g while the gondola was in free falling, than the maximum acceleration recorded was -1.5 g when the parachute deployed. From the accelerometers along the Y and X axis and from the gyros readings can be noticed that the gondola is tumbling and oscillating a little when the parachute deployed.
After a small transient (probably when the gondola reached an almost constant speed descent rate) an oscillatory behavior of the vertical accelerometer can be noticed. Particularly, the acceleration along the vertical axis changes periodically between -0.5 and -1.5 g. The period is almost 1 Hz and can be due to the elastic energy accumulated by the flight train during the deceleration phase short after the parachute deployed. Thus, the flight train in this phase is acting as a spring that is periodically compressed and extended.
The maximum vertical acceleration recorded during the landing has been of almost 3 g. We can say that it has been a real soft landing, thank you Bexus 6!
More information about Bexus launch campaign (3rd-11th October 2008).
Shipment of the experiment to Esrange On 24th September, we were ready to ship our experiment to Esrange, where we will arrive on 3rd October for the Bexus 6/7 launch campaign.
Overall hardware & software testing Short after the delivery of the flight unit PCB from Artel Srl, the company in charge for the PCB manufacture, we started a test campaign on the flight unit. After a simple check of the power supply lines, all the sensors have been integrated and fully tested. The onboard software together with the ground station software have been fully tested with several 10 hours long-runs. During the test all LowCoINS functionality have been tested. Each long-run has been followed by a complete memory dump, thus, the data dumped from memory have been compared with the recorded telemetry data to find mismatches. After the successful memory to telemetry comparison, the memory has been erased followed by a blank check. A problem came out during these tests on the flight unit number one: the memory bank nr. 3 and 4 didn’t contain coherent data, and data in the affected memories were written irregularly. The problem was a bad solder on the ground pin of those memory chip. The issue has been fixed and long-run test repeated several time to check the success of the repair. Below a picture of the flight unit number one under test, in foreground the external power supply used during long-run test showing the current consumption of the unit (70 mA).
IMU testing – Sampling frequency ADIS16355 is the core of our experiment, so particular attention has been focused to this component to find out the good setup to use it in the best condition. This high integration sensor is fully programmable, and one of the main feature is that it is possible to setup the internal sampling frequency of the sensor. Acting on the sampling frequency, we found out that it were possible to increase the stability of the data outputted reducing the sampling frequency, narrowing the bandwidth, thus reducing the noise. The sensor has also a built in Barlett Window Digital Filter to increase output stability.
It has been necessary to find out the best trade off between output stability and response time acting on the sampling frequency and filter setting. This has been accomplished making several acquisition campaign from the sensor for a fixed time window (10 minutes) with different IMU settings.
Then the variance of each IMU output (accelerometers and gyros channels) has been calculated. Since we read the IMU register asynchronously with respect to its update rate, an high sampling rate is desirable to lower the error due to sampling delay, and at the same time a low sampling rate is desirable to lower the output noise. The best compromise has been found out to be 102 Hz with the filter set to 32 taps.
IMU testing – Accelerometers calibration The performances of an accelerometer is usually investigated using a series of static and dynamic test procedures. A multi-position tests are undertaken using a precision dividing head. This type of equipment enables the sensitive input axis of an accelerometer to be rotated with respect to the gravity vector. Hence, the component of gravity acting along the input axis of the sensor may be varied very precisely. The purpose of the multi-position tests is to determine the following parameters of an accelerometer:
The experiment is fasted firmly to a precision dividing head, and the outputs from accelerometers are recorded for four different attitudes of the sensitive axis corresponding to 0g, 1g, 0g, -1g acting along this axis. Rotating the tilt-table in order to point each sensitive axis alternately up and down (six point test) it is possible to estimate the factors mentioned earlier simply summing and differencing various combinations of accelerometer measurements. Since the tilt table used for these procedures cannot tilt the vertical axis 180°, but it can only be tilted 90°, the calibration procedure turned into a five-position test. This imply that our calibration is excellent for attitudes of the IMU that are different from the upside-down situation, that it is reasonably true on a balloon flight. Below a picture representing the orientation of the IMU axis in the different positions.
The output from the accelerometers can be written:
where the diagonal elements of the m matrix represent the scale-factors of each accelerometer axis, the out-of-diagonal elements represent the misalignment of the axis, the b vector represent the bias. The m matrix and bias vector for our IMU came out to be:
In the following table can be noticed the improvements of the data accuracy after the calibration for each axis in each of the five positions:
Magnetometers testing and calibration The magnetometers’ output is a square wave frequency modulated. What the microprocessor does is to measure the period of the output signal. Unfortunately, the response of the sensors is not linear, and an appropriate transfer function needed to be found. The response is linarized using the following formula:
The linearization technique we adopted is to compare the output periods at full scale negative and positive field with the zero field period.
The procedure we adopted is to align each sensitive axis alternatively towards the magnetic north and south. Thus, becoming Hmin=-24125 µTesla, Hmax=24125 µTesla which is the north component of the earth magnetic field in the test site. Then the sensitive axis is pointed towards east and Ho is assumed to be 0 µTesla. Even this affirmation is not completely true, since a not-zero component exists in the east-west direction, it is so small that can be neglected in our considerations. In this way the c coefficients can be found and placed in the linearizing formula to obtain a linear response from the sensors. The procedure is undertaken using a precision dividing head made of non ferrous materials (actually wood and plastic). The calibration has been attended outside the NGI plant where a north pointing arrow mark is placed on the ground. The procedures lead to an overall heading error of 1.5°, but we believe it can still be lowered. The calibration procedure is then repeated with the heater switched on in order to evaluate the deviation due to the high current flowing in the heater. The results show that the total deviation is no more than +2° in the first two quadrant and -2° in the second two.
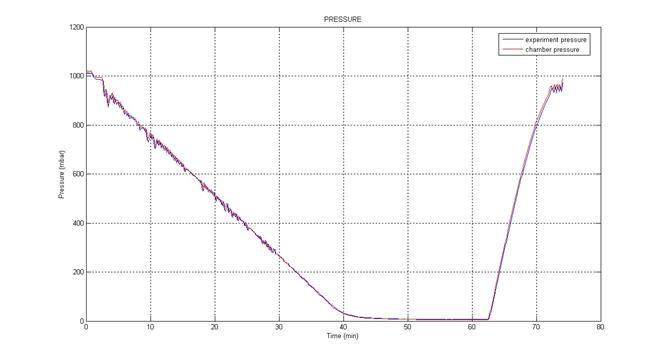
A test in vacuum chamber at constant temperature has been conducted to evaluate the performances of the Honeywell pressure sensor. The pressure in the chamber has been lowered down to 5 mbar and then raised quickly to ambient pressure after a long period of stabilization in near vacuum. The test results showed that the pressure sensor is within specification having a small average bias of 7 mbar.
Thermal-vacuum test with battery The last test we did is a thermal-vacuum test to simulate the condition we expect during the flight with the unit complete.
The test condition foresees to lower the temperature down to -65 °C and then, after a stabilization period, lower the pressure to 5 mbar, holding these conditions for 5 hours (the expected maximum flight duration). Afterwards the pressure is restored to ambient pressure, then the temperature is raised to 25 °C. The total test duration is 8 hours. PCB, IMU and heater temperatures are measured and recorded by the experiment itself, the battery, internal air and external air temperatures are recorded with external thermocouples.
The test was successful, the unit succeeded to keep the temperature of the electronics above 10 °C for the entire period of the test. By the way, after the test, the unit remained switched on the whole night (at 25 °C) because we needed to dump the memory. When we returned the day after, LowCoINS was still working regularly. The total discharge of the battery during the test was a capacity of about 3.7 Ah against the 13 Ah total nominal battery capacity. Nevertheless, the expected capacity for the battery pack during the flight we assumed to be about 7 Ah, because of the de-rating due to the low operating temperature of 0 °C. This temperature was an estimate we did during the design phase of the experiment, and our guess was really good since the recorded battery temperature during the test oscillated between -2 °C and 5 °C. Even considering the battery capacity de-rated to 7 Ah (and it is a big underestimate, since the battery will not work for the entire flight time at 0 °C) the total experiment autonomy with its own battery pack will nearly reach 10 hours. The supply voltage was stable during the entire test and did not showed any marked change when the heater is switched on and off.
Final housing and mounting interface The box is provided with brackets on the 4 sides. All of them are required to attach the experiment to calibration devices, mainly tilt and rate table. Connection to the payload gondola is assured by two beams placed under the experiment box. Two sets of mounting bar have been developed to match the gondola rails in both side of the gondola, the larger and the narrower (320 – 375 mm).
Considering the thickness of rivets and “L-shaped” corners, the overall experiment dimension is 21x21x17 cm. The final mass is 3300 g. For more details about experiment mass budget and mechanical design, you can see the sections "Mass & Power Budget" and "Mechanical Design".
Ground Station SoftwareSoftware for live data recording has been developed using National Instruments Labview 8.5. It allows to manage every aspect of LowCoINS experiment: · Live data recording · IMU management, sensor sampling rate, digital filtering, calibration and bias set up · Memory management: memory erase, memory dump · Thermal control unit management: allows for change temperature threshold that triggers the heater also during the flight, and allows for manual control of the heater. · Estimated remaining battery charge Three different versions have been developed: 1. Flight mode: to be used for live data recording during the flight. This version has the ability to send only the TCs needed during the flight, does not have the TCs for the calibration of the unit. 2. Service mode: to be used to calibrate the sensors and debug. 3. Memory Dump: to be used to read the data from the flash memory and save in the PC.
Below the screenshots of the different software:
Onboard SoftwareThe onboard software is very simple and straightforward. There is a main loop that occur every 50 ms, regulated by a microcontroller timer, that holds all the principal tasks.
The unit has two main state: “Flight Mode” and “Service Mode”. The Flight Mode is the default state. In this mode the unit acquires data from sensors, sends telemetry and writes to memory, if enabled. It is able to receive a limited number of telecommands, and the TC reception is assured by periodically polling the RX buffer. In Service Mode, the unit is able to receive long telecommands for calibrations purposes. In this state the TCs are handled with an Interrupt Service Routine (ISR) because the RX buffer is not big enough to receive the entire TC. This causes the telemetry packet to be corrupted when a TC is sent to the unit, and this is the main reason for the existence of two modes, “flight” and “service”. While in Service Mode, the unit can go to the “memory dump mode” state. In this case the data acquisition is halted until the unit remains in memory management mode.
There are three interrupt service routines:
A C-compiler (CCS) has been used to program the microcontroller.
List of TelecommandLowCoINS experiment is able to receive either from e-link serial port or service serial port several telecommands. Thermal Control Telecommands
Calibration Telecommands
Memory Dump Telecommands
4th thermal test in thermal chamber
Results show that in the first test phase (Tlow=10 °C ; Thigh=12°C) the heater duty cycle is 44 % with an heater switching frequency of 3.6 cycles/hour. When the set points are lowered (Tlow=5 °C ; Thigh=7°C) the heater duty cycle decreases to 39 % with an heater switching frequency of 3.3 cycles/hour. The lowest temperature reached in this case is 0 °C when the sea-level pressure is restored with the external temperature steady at -65 °C. The test showed that is possible to save some power lowering temperatures threshold, however the power saved is negligible.
3rd thermal test in thermal chamber The experimental setup is as follow:
On experiment prototype:
The thermal-vacuum chamber has been programmed to pursuit the following situation:
Since it is not allowed to decrease the temperature and pressure simultaneously due to thermal chamber limitation, the test program foresaw this profile:
The prototype communicates with a PC through RS-232 interface providing
readings from temperature and pressure sensors and heater status. The
thermal control software switches the heater on whenever the temperature
sensors placed above the PCB (T0) falls below Tlow,
than switches it off when the temperature rise above Thigh. Tlow
and Thigh are user selectable sending appropriate telecommand
to the unit. Moreover, it is possible to go to “manual heater control”
and switch the heater on and off manually. The heater is placed above
the PCB and it is able to dissipate about 10 W of power. The purpose of
the test is to check if this power is sufficient to keep the temperature
in the safe limit and to determine the heater duty cycle in order to
evaluate the overall power consumption.
2nd thermal test in thermal chamber
1st thermal test in thermal chamber
Thermal test with active thermal controlBelow are reported results of a thermal test conducted in a common freezer at -20 °C. Four temperature sensors are placed on the prototype board: two on the component side, one on the bottom and one on the heating panel.
The microprocessor switches the heater on whenever the temperature T0 (center sensor component side) falls below 15 °C and turn the heater off above 20 °C. The heating element is composed by two high power resistor of 5.6 Ohm. The resistors are rated for a maximum power of 50 W, however in the experiment they are required to provide a power 10 times smaller, in fact the total heater power is set to 10 W. The heater is turned on and off with a low resistance logic level power mosfet driven by a logic port of the microprocessor. The status is recorded in real time using a software that allows for watching temperatures, set the low and high threshold temperature and command the heater on and off either manually or automatically.
Results shows temperature transients and the
heater status versus time.
It can be noticed the heater duty cycle is about 30 % at an actual temperature difference between the inside and the outside of the box of 35±40 °C. Results are encouraging but an upcoming thermal-vacuum test will validate the results in absence of free-convection.
HousingAluminium boxes are built with panels connected with “L-shaped” corners and rivets. Foam panels are placed in between and glued to the metal cases.
First thermal test
The thermal experiment consists in a box made of 3 cm tick dense foam panel with aluminium skins. Inside the box a 7 W heater and a LM335 temperature sensor has been installed. Test has been contucted maintaining the outside temperature at -20°C. The internal temperature measurement has been dumped to a pc through an RS232 interface for recording.
The plot shows that equilibrium temperature is reached after 65 minutes with an overall temperature difference between the inside and the outside experiment insulation box of 70 °C, then the heater has been switched off and on, in order to evaluate the total duration of temperature transient working around 0 °C.
First small prototypeWe already built a prototype that successfully flew two times onboard a small model rocket. The prototype was able to acquire the longitudinal acceleration of the rocket with a sampling rate of 100 Hz. Although it does only a part of the job that an IMU has to do, it has demonstrated the feasibility of a small and compact IMU.
In this figure is represented the longitudinal acceleration profile of the rocket busted by a B6 solid propellant engine.
|