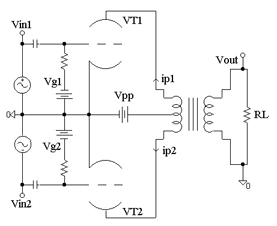
A
true push-pull amplifier, Fig. 1, presents at least two Vacuum Tubes, drived simultaneously
from two identical out-of-phase signals. This system can
realize a true differential-to-single_ended
conversion and extract, inthe most
efficient way, power from
vacuum tubes. Most of the commercial
power amplifiers both for professional and high-end market relies on this
configuration in the output stage.
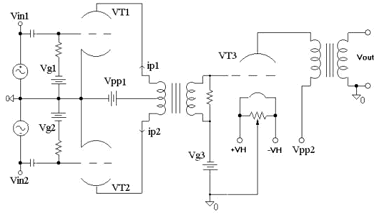
You
can also find a push-pull stage, mainly in Japanese realizations, as driver
for single_ended amplifiers
with powertubes of the
transmitting variety, Fig. 2.
Fig.
2 A Push-Pull Driver for a Single Ended Output Stage
In a true push-pull stage the signal on the secondary of the output
transformer it’s caused by
a process that includes also a differentiation; this permits the theoretical
cancellation of
even harmonics and, for triodes, also a sensitive reduction in the THD
and InterModulation Distortion (IMD).
and
therefore the perfect cancellation of even harmonics is obtained.
An
ideal push-pull with triodes presents the maximum output power when:
RLp-p=
2*ri(20)
whereri is the internal resistance
exhibited from each triode. Besides:
RLp-p
<2*ri
produces higher distortion and lower power, while
RLp-p
>2*ri
produces both lower distortion and power.
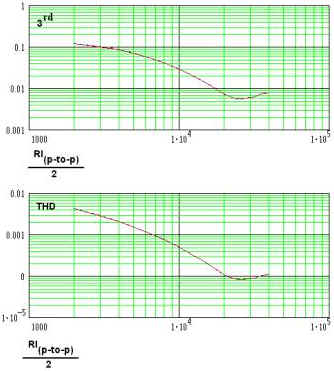
From
a theorethical point of view it’s interesting to observe thatthe reduction
in the THD when RLp-p increases, is not indefinite because very high value
for RLp-p can cause an increase in the 3rd harmonic that being the
most significative component in the output spectrum can produce
an increase in the T.H.D. Fig. 3 shows this phenomenon on a simulated
push-pull stage.
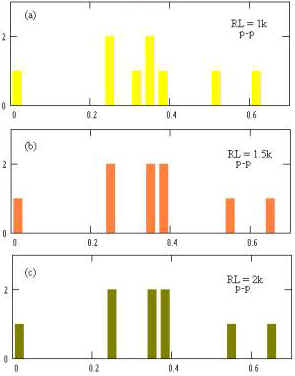
More
interesting appears instead the possibility to analyze the spectral
behaviour in presence of structural asymmetries. In fact a real push-pull
amplifier willalways present
asymmetries as umbalancing in the bias current,slightly
different driving signals,different
half-primary impedance and so on.
Fig.
3 3rd harmonic vs. THD in a Push-Pull Stage
If
the unbalancing is of small entity it cannot produce harmful effects
from a sonic point of view since the most effect consists in the
production of even harmonics, further some designers are convincedthat these asymmetries can be
useful because they would eliminate theharsheness that an “unbalanced”
spectrum with only odd armonics
shows. I believe that the reproduction of a more pleasant sound not always means
a sound close to the real event, in fact an alterated harmonic spectrum can in
some cases
color the sound in a manner that could apper
Fig.
4 The Frequency Distribution Histogram of 2nd Harmonic
us
very pleasant. Pro-audio amplifiers can take advantage from a colored
sound but hi-fi amplifiers must aim to a neutraland indistorted sound.
Nevertheless
a study of the asymmetries in an output push-pull
stage could return useful on the attempt to reduce or null the
output distortion with the HCT by mixing its harmonics with those
produced by previous stages of the amplifier. For this studyI have built a push-pulloutput stage with 300B Vacuum Tube
with the following bias point:
Vp=300Vcc,
Vg=-61Vcc, Ip=60mA;
Fig.
5 The Frequency Distribution Histogram of 3rd Harmonic
and
simulated a MonteCarlo
Analysis with MicroSim
DesignLab Ev. Rel 8.0
with a 10%
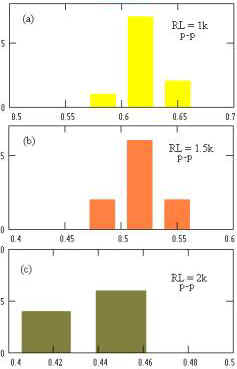
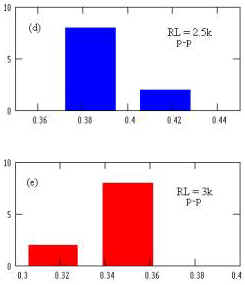
Uniform Deviation in the half-primary inductance of thepush-pull
transformer when RLp-p is 1kW,
1.5k W, 2kW,
3kW
rispectively.
Subsequently
I have processed the output data with MathCad
Pro 6.0 in order toproduce Frequency Distribution
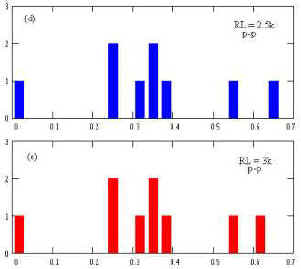
Histogram (FDH) of 2nd
and 3rd harmonics. In
Figg. 4 and 5X-axis represents the
value (in Volts) of harmonics and y-axis representthe number of samples. This means,
for example, that in Fig. 4babout
six samples with 2nd harmonic values between 0.2 and 0.4V when RLp-p=1.5k.
The
samples close tothe origin (with a
very low voltage therefore)represent
the better case since they refer to a null unbalancing condition
(during a MonteCarlo
with a given number of iterations
Pspice always performs at first a simulation to nominal value of the varying
parameter – that is in this case the semiprimary inductance ). When an
unbalancing of this level occours, Fig. 4 reveals a good insensibility of
the 2nd harmonic to load variations. In fact the FDHs preserve always
the same qualitative shape. The increase of the load resistance is surely
the primary cause that produces an amplitudereductionof the 3rd
Harmonic
samples, Fig. 5. Therefore you can see a push-pull stage as a rigid structure
since in the best condition of operation produces practically only odd
harmonic thatcould be eliminate
hardly increasing the value of load
resistance; on the contrary when unbalanced it produces even harmonics
insensitive to the load variations. Nevertheless small unbalancing , in
the case of triodes don’t result harmful, even theoretically it’s possible
to
make a push-pull stage also with different triodes [1].
[1]
F. Langford-Smith
Radiotron Designer’s Handbook R.C.A.,
p. 509 Chap. XII, pp. 580-81 Cap. XIII,
Cap XIV4th
Ed., 1953.
What did you
think of this article? Click here
to send us your comments, feedback and suggestions