Engine Load at Different Scales[2006.07.14] |
|
|
We have discussed in several mails about the effect that a scale change would have on Unreal Engine performance. As words can prove nothing, I thought it was time to let the numbers to show us the truth :-).
Even if the engine uses always 100% of the CPU we can still measure its performance through the frame rate or, better, the inverse of the frame rate. This value tells us precisely how long it takes to compute each frame. A longer computation time means lower performance. If a frame takes 10ms at scale A and 15ms at scale B (same position and orientation in the map) we'll all agree that the scale A is more efficient. Different scales can lead to different frame rates because of internal engine optimizations.
To log the engine performance I wrote a small script: ![]() FPSLog.zip. Complete instructions are provided in the header of the file.
FPSLog.zip. Complete instructions are provided in the header of the file.
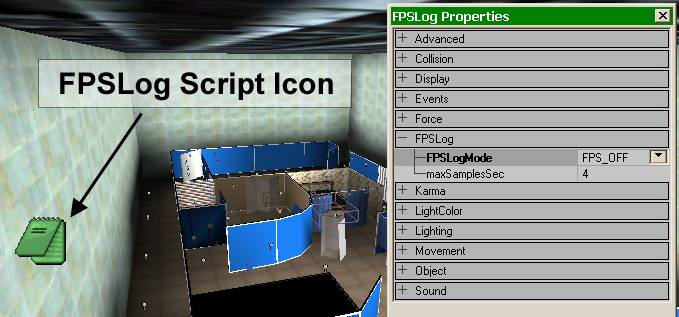 |
To use the script place it in a map and set its FPSLogMode to FPS_ON |
The idea is: spawn a robot at different positions in a map, log engine performance at each position, then change the scale (both for robot and map) and redo the tests using the same positions. Compare the results.
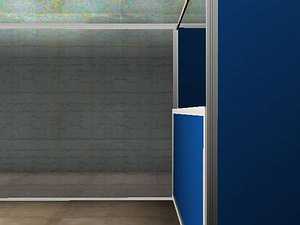
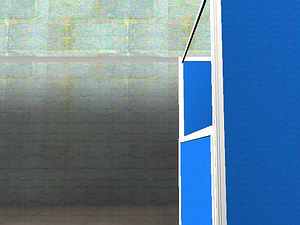
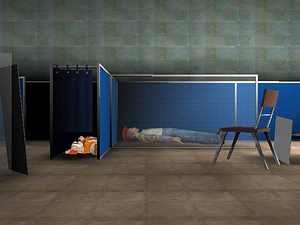
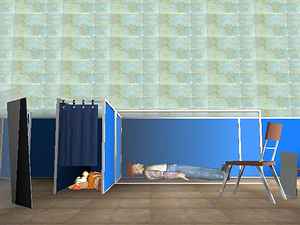
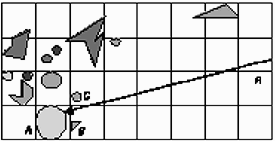
I chose the Yellow map (had no time to build a custom map at both scales) and the P2DX robot. I also disabled all its sensors at exception of the SICK laser scanner. The following figure shows the position and orientation of the 3 starting locations chosen for the test:
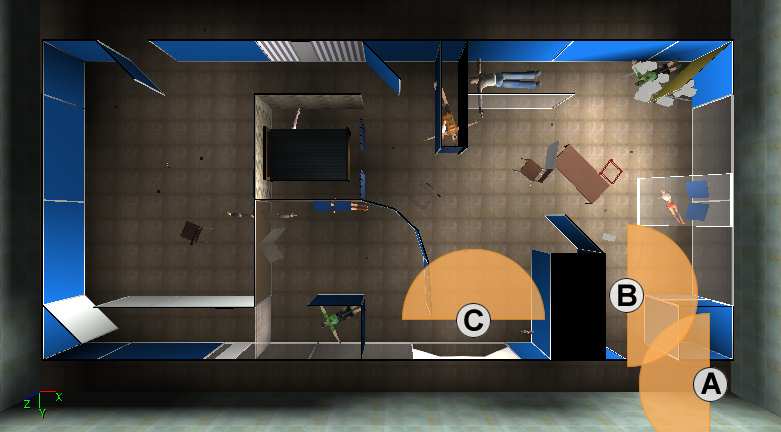 |
Start Location A: an attempt to test long range scanning.
Start Location B: short range scan.
Start Location C: mid range scan with complex geometries.
You can download all the following reports (Excel format): ![]() LoadGraphs.7z
LoadGraphs.7z
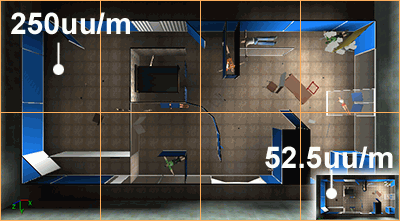
Scale 250uu/m |
Scale 52.5uu/m |
|
 |
 |
|
 |
 |
|
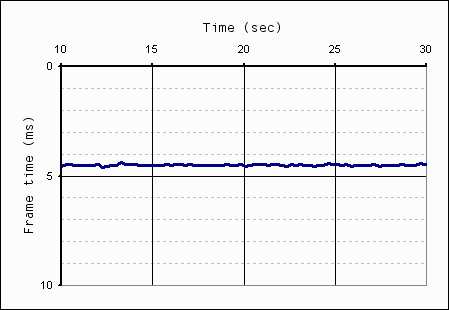
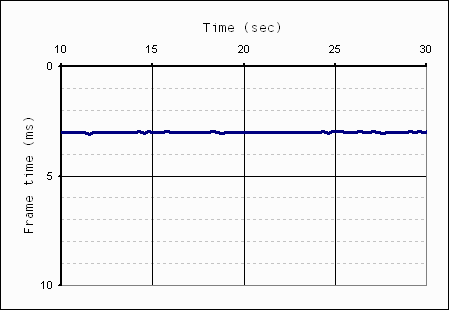
Map without robots (250uu/m) |
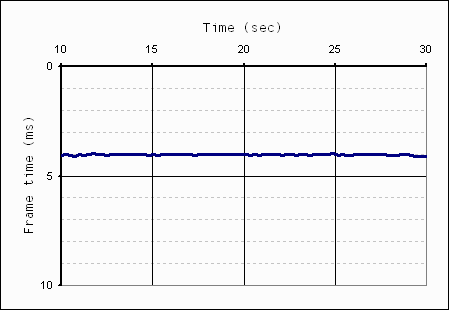
Map without robots (52.5uu/m) |
|
 |
 |
|
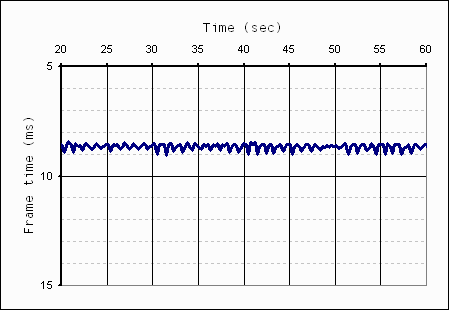
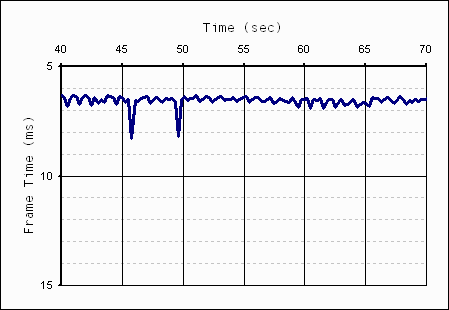
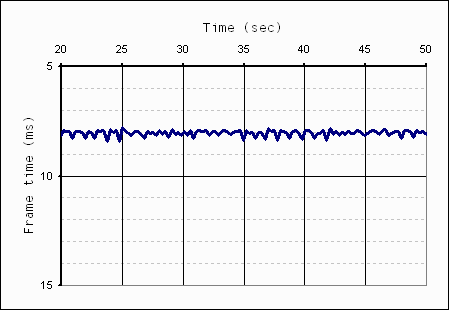
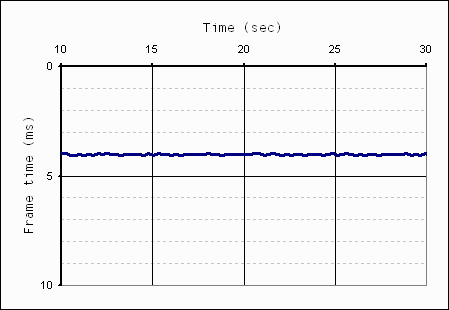
Map with P2DX (250uu/m) |
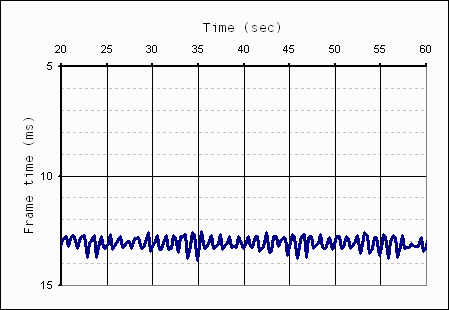
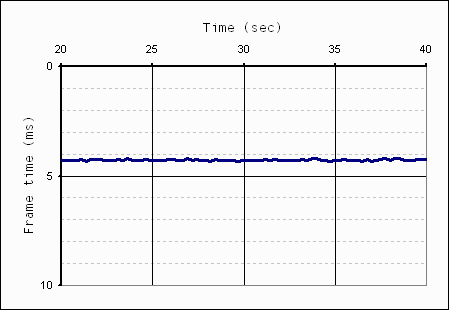
Map with P2DX (52.5uu/m) |
The performance drop that a robot introduces is equal to:
Load = [average Frame time with the robot (graph below)] - [average Frame time without the robot (graph above)]
It's clear that the smaller scale eats much more cpu time (almost 5ms) in a long range scan. This result could appear unintuitive, however we should consider at least two things:
Unreal Engine seems to prefer bigger scales to smaller ones. See octrees for a possible explanation.
Scale 250uu/m |
Scale 52.5uu/m |
|
 |
 |
|
 |
 |
|
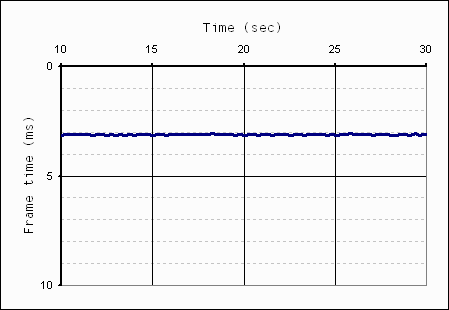
Map without robots (250uu/m) |
Map without robots (52.5uu/m) |
|
 |
 |
|
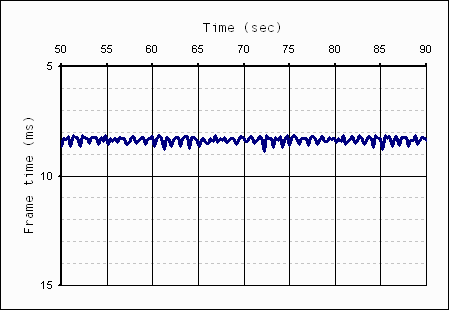
Map with P2DX (250uu/m) |
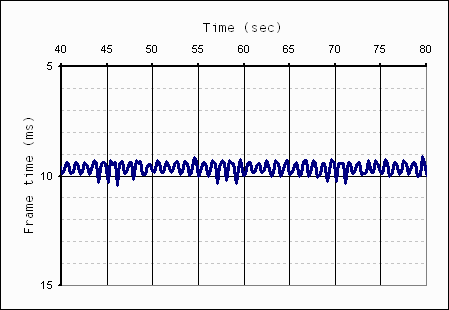
Map with P2DX (52.5uu/m) |
Small scale is still a bit slower. Notice that the geometry scale is irrelevant to computation speed, only engine optimizations are important.
Scale 250uu/m |
Scale 52.5uu/m |
|
 |
 |
|
 |
 |
|
Map without robots (250uu/m) |
Map without robots (52.5uu/m) |
|
 |
 |
|
Map with P2DX (250uu/m) |
Map with P2DX (52.5uu/m) |
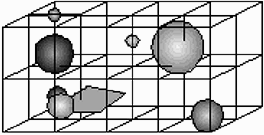
Octrees are a way to partition space and possibly build a spatial-occupancy hierarchy. They allow to quickly extract the relevant subset or reject unneeded geometry boosting rendering speed.
 |
 |
|
Octree |
Quadtree |
I suppose Unreal Engine also uses octrees (together with other optimizations, like BSP). If so, this figure shows a possible explanation for the higher computation time at smaller scale:
 |
A bigger map is better partitioned than a smaller one. This way the geometric engine can extract only a subset of map triangles resulting in a faster execution. Smaller maps have higher density with more localized data. Depending on how the octree was implemented, this can slow down graphics algorithms.
However, this is only a possibility.
The easy conclusion is that the only way geometry scale influences performance is through engine optimizations. With the smaller scale (52.5uu/m) we experienced a speed drop of 1ms to 5ms. As 4ms are necessary to simulate a P2DX (compare 250uu/m scale graphs) this means that we're wasting relevant processing power. Using a bigger scale we could simulate more robots or have higher frame rates.
![]()
![]()