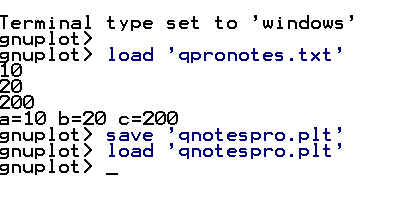
programma scritto con NOTES
con notes tipo txt con wordpad tipo txt con notes tipo dat
# programma scritto con notes
# deve essere salvato cone file.txt con SAVE "nome.txt"
# deve essere richiamato con OPEN "nome.txt"
# quando viene visualizzato può essere salvato con SAVE "nome.plt"
# può essere richiamato con OPEN "nome.plt"
#
# in fase di esecuzione non vengono visualizzate le istruzioni
# inserite nel programma
# nel caso di errori evidenziati, aprire il file nome.txt con NOTES
# correggere listato e salvare con SALVA
# richiamare con OPEN "nome.file" e verificare effetto correzione
#
a=10
b=20
c=a*b
print a
print b
print c
print "a=",a," b=",b," c=",c
pause -1
plot sin(x),cos(x)
pause -1
# pause - 1 attende pressione INVIO per proseguire
richiamato( con FrontPage)come file
nome.plt :visualizza codice automatico creato nella registrazione
( per significato codici cfr.descrizione in altre pagine o nella
guida HELP-comandi,indice)
#!/gnuplot
#
#
#    	G N U P L O T
#    	MS-Windows 32 bit version 3.7
#    	patchlevel 1
#    	last modified Fri Oct 22 18:00:00 BST 1999
#
#    	Copyright(C) 1986 - 1993, 1998, 1999
#    	Thomas Williams, Colin Kelley and many others
#
#    	Type `help` to access the on-line reference manual
#    	The gnuplot FAQ is available from
#    	<http://www.ucc.ie/gnuplot/gnuplot-faq.html>
#
#    	Send comments and requests for help to <info-gnuplot@dartmouth.edu>
#    	Send bugs, suggestions and mods to <bug-gnuplot@dartmouth.edu>
#
# set terminal windows
# set output
set noclip points
set clip one
set noclip two
set bar 1.000000
set border 31 lt -1 lw 1.000
set xdata
set ydata
set zdata
set x2data
set y2data
set boxwidth
set dummy x,y
set format x "%g"
set format y "%g"
set format x2 "%g"
set format y2 "%g"
set format z "%g"
set angles radians
set nogrid
set key title ""
set key right top Right noreverse box linetype -2 linewidth 1.000 samplen 4 spacing 1 width 0
set nolabel
set noarrow
set nolinestyle
set nologscale
set offsets 0, 0, 0, 0
set pointsize 1
set encoding default
set nopolar
set noparametric
set view 60, 30, 1, 1
set samples 100, 100
set isosamples 10, 10
set surface
set nocontour
set clabel '%8.3g'
set mapping cartesian
set nohidden3d
set cntrparam order 4
set cntrparam linear
set cntrparam levels auto 5
set cntrparam points 5
set size ratio 0 1,1
set origin 0,0
set data style points
set function style lines
set xzeroaxis lt -2 lw 1.000
set x2zeroaxis lt -2 lw 1.000
set yzeroaxis lt -2 lw 1.000
set y2zeroaxis lt -2 lw 1.000
set tics in
set ticslevel 0.5
set ticscale 1 0.5
set mxtics default
set mytics default
set mx2tics default
set my2tics default
set xtics border mirror norotate autofreq
set ytics border mirror norotate autofreq
set ztics border nomirror norotate autofreq
set nox2tics
set noy2tics
set title "" 0.000000,0.000000  ""
set timestamp "" bottom norotate 0.000000,0.000000  ""
set rrange [ * : * ] noreverse nowriteback  # (currently [0.000000:10.0000] )
set trange [ * : * ] noreverse nowriteback  # (currently [-5.00000:5.00000] )
set urange [ * : * ] noreverse nowriteback  # (currently [-5.00000:5.00000] )
set vrange [ * : * ] noreverse nowriteback  # (currently [-5.00000:5.00000] )
set xlabel "" 0.000000,0.000000  ""
set x2label "" 0.000000,0.000000  ""
set timefmt "%d/%m/%y\n%H:%M"
set xrange [ * : * ] noreverse nowriteback  # (currently [-10.0000:10.0000] )
set x2range [ * : * ] noreverse nowriteback  # (currently [-10.0000:10.0000] )
set ylabel "" 0.000000,0.000000  ""
set y2label "" 0.000000,0.000000  ""
set yrange [ * : * ] noreverse nowriteback  # (currently [-10.0000:10.0000] )
set y2range [ * : * ] noreverse nowriteback  # (currently [-10.0000:10.0000] )
set zlabel "" 0.000000,0.000000  ""
set zrange [ * : * ] noreverse nowriteback  # (currently [-10.0000:10.0000] )
set zero 1e-008
set lmargin -1
set bmargin -1
set rmargin -1
set tmargin -1
set locale "C"
a = 10
b = 20
c = 200
plot sin(x),cos(x)
#    EOF
programma scritto con WorPad e registrato come nome.txt
# programma scritto con WorPad per gnuplot
#
a=10;b=20;c=a*b
print a
print b
print c
pause -1
plot sin(x),x,cos(x)
pause -1
# registra come pscrive2.txt
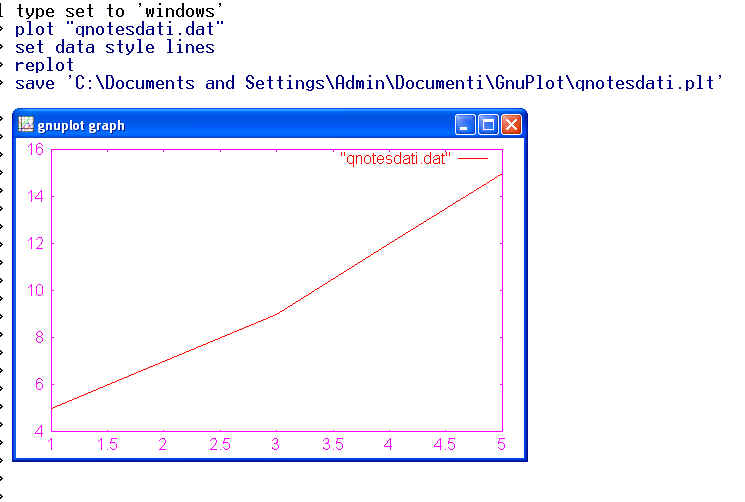
# file di dati qnotesdati.dat
1 	5
2	7
3	9
4	12
5	15
richiamato con Plot "qnotesdati.dat"
salvato con Save "qnotesdati.plt"