comandi ( cfr.guida per integrazione informazioni)
| cliccare | |
| cd | gestione directory |
| call | carica file (cfr.load) |
| clear | cancella schermo |
| exit | esce da programma |
| fit | gestione funzioni elaborata |
| help | richiama help |
| if | gestione controlli |
| load | carica file |
| pause | gestione pausa |
| plot | gestione disegno 2D |
| stampa dato | |
| pwd | stampa directory corrente |
| quit | esce da programma |
| replot | ridisegna grafo dopo modifica |
| reread | gestione controllo e ciclo |
| reset | riassegna valori default |
| save | gestione registrazione file |
| set-show | gestione visualizzazione dati |
| shell | gestione directory e DOS |
| splot | gestione disegno 3D |
| test | gestione confronto |
| update | gestione aggiornamento file |
exit
funzione un poco complessa da spiegare...lascio agli esperti...
elaborazione automatica
disegno prima della elaborazione
disegno dopo la elaborazione
codice registrato
automaticamente in directory corrente come fit.log
esempio
ultimo considerato
Fri Oct 13 10:51:46 2006
*******************************************************************************
Fri Oct 13 10:22:07 2006
FIT:    data read from 'xydata.dat' using 1:2:3
BREAK:          No data to fit
*******************************************************************************
Fri Oct 13 10:26:00 2006
FIT:    data read from "xydata.dat" using 1:2:3
BREAK:          No data to fit
*******************************************************************************
Fri Oct 13 10:26:46 2006
FIT:    data read from "xydata.dat" using 1:2
        #datapoints = 9
        residuals are weighted equally (unit weight)
function used for fitting: f(x)
fitted parameters initialized with current variable values
Iteration 0
WSSR        : 3075.54           delta(WSSR)/WSSR   : 0
delta(WSSR) : 0                 limit for stopping : 1e-005
lambda	  : 0.791963
initial set of free parameter values
a               = 1.2345
b               = 2.3456
After 10 iterations the fit converged.
final sum of squares of residuals : 2975.59
rel. change during last iteration : -1.1783e-008
degrees of freedom (ndf) : 7
rms of residuals      (stdfit) = sqrt(WSSR/ndf)      : 20.6176
variance of residuals (reduced chisquare) = WSSR/ndf : 425.084
Final set of parameters            Asymptotic Standard Error
=======================            ==========================
a               = -3.63314         +/- 9.506        (261.6%)
b               = 3.12878          +/- 2.741        (87.59%)
correlation matrix of the fit parameters:
               a      b
a               1.000
b              -0.030  1.000
*******************************************************************************
Fri Oct 13 10:32:28 2006
FIT:    data read from "zdata.dat" using 1:2:3
        #datapoints = 9
function used for fitting: f(x)
fitted parameters initialized with current variable values
Iteration 0
WSSR        : 113392            delta(WSSR)/WSSR   : 0
delta(WSSR) : 0                 limit for stopping : 1e-005
lambda	  : 2.27053
initial set of free parameter values
a               = 1.2345
b               = 2.3456
c               = 3.4567
After 11 iterations the fit converged.
final sum of squares of residuals : 24359.2
rel. change during last iteration : -6.69528e-009
degrees of freedom (ndf) : 6
rms of residuals      (stdfit) = sqrt(WSSR/ndf)      : 63.717
variance of residuals (reduced chisquare) = WSSR/ndf : 4059.86
Final set of parameters            Asymptotic Standard Error
=======================            ==========================
a               = 27.8388          +/- 13.92        (50%)
b               = -11.969          +/- 0.6856       (5.728%)
c               = 32.4603          +/- 15.64        (48.17%)
correlation matrix of the fit parameters:
               a      b      c
a               1.000
b              -0.152  1.000
c              -0.247  0.852  1.000
*******************************************************************************
Fri Oct 13 10:51:46 2006
FIT:    data read from "zdata.dat" using 1:2:3
        #datapoints = 9
function used for fitting: f(x)
fitted parameters initialized with current variable values
Iteration 0
WSSR        : 113392            delta(WSSR)/WSSR   : 0
delta(WSSR) : 0                 limit for stopping : 1e-005
lambda	  : 2.27053
initial set of free parameter values
a               = 1.2345
b               = 2.3456
c               = 3.4567
After 11 iterations the fit converged.
final sum of squares of residuals : 24359.2
rel. change during last iteration : -6.69528e-009
degrees of freedom (ndf) : 6
rms of residuals      (stdfit) = sqrt(WSSR/ndf)      : 63.717
variance of residuals (reduced chisquare) = WSSR/ndf : 4059.86
Final set of parameters            Asymptotic Standard Error
=======================            ==========================
a               = 27.8388          +/- 13.92        (50%)
b               = -11.969          +/- 0.6856       (5.728%)
c               = 32.4603          +/- 15.64        (48.17%)
correlation matrix of the fit parameters:
               a      b      c
a               1.000
b              -0.152  1.000
c              -0.247  0.852  1.000
help abs
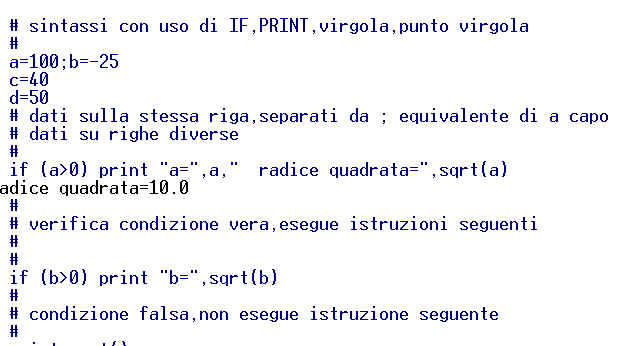
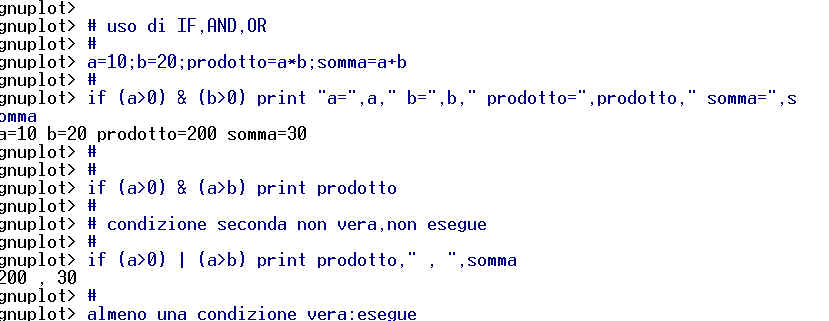
comando usato nel controllo di condizioni vere o false


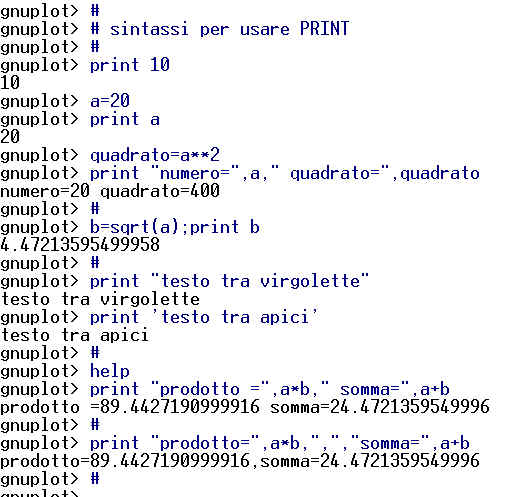
notare uso di virgolette e apici,della virgola,degli spazi,del punto virgola
virgola separa istruzioni sulla stessa linea...punto virgola equivale a mandare a capo

quit
dopo aver disegnato come sopra,si inserisci comado per griglia e Replot
reread vedi anche iterazione xciclo1 xitera4 zitera1
permette iterazione istruzioni se si verifica condizione imposta
(nell'esempio
sottostante si verifica un ciclo continuo...chiudere con clic su
X )
(vedere esempi funzionanti con altri due link)
disegna senza griglia
aggiunge griglia e attiva Replot
attiva Reset e torna a condizione iniziale, senza griglia
permette di
sostituire copia file modificata a una precedente
disegnare grafico e salvare come rivedi.plt
modificare grafico(es sfondo,griglia)
replot
salvare copia modificata
con comando : update "rivedi.plt"
viene resistrata la modifica in sostituzione dell'originale
file modificato e salvato con update