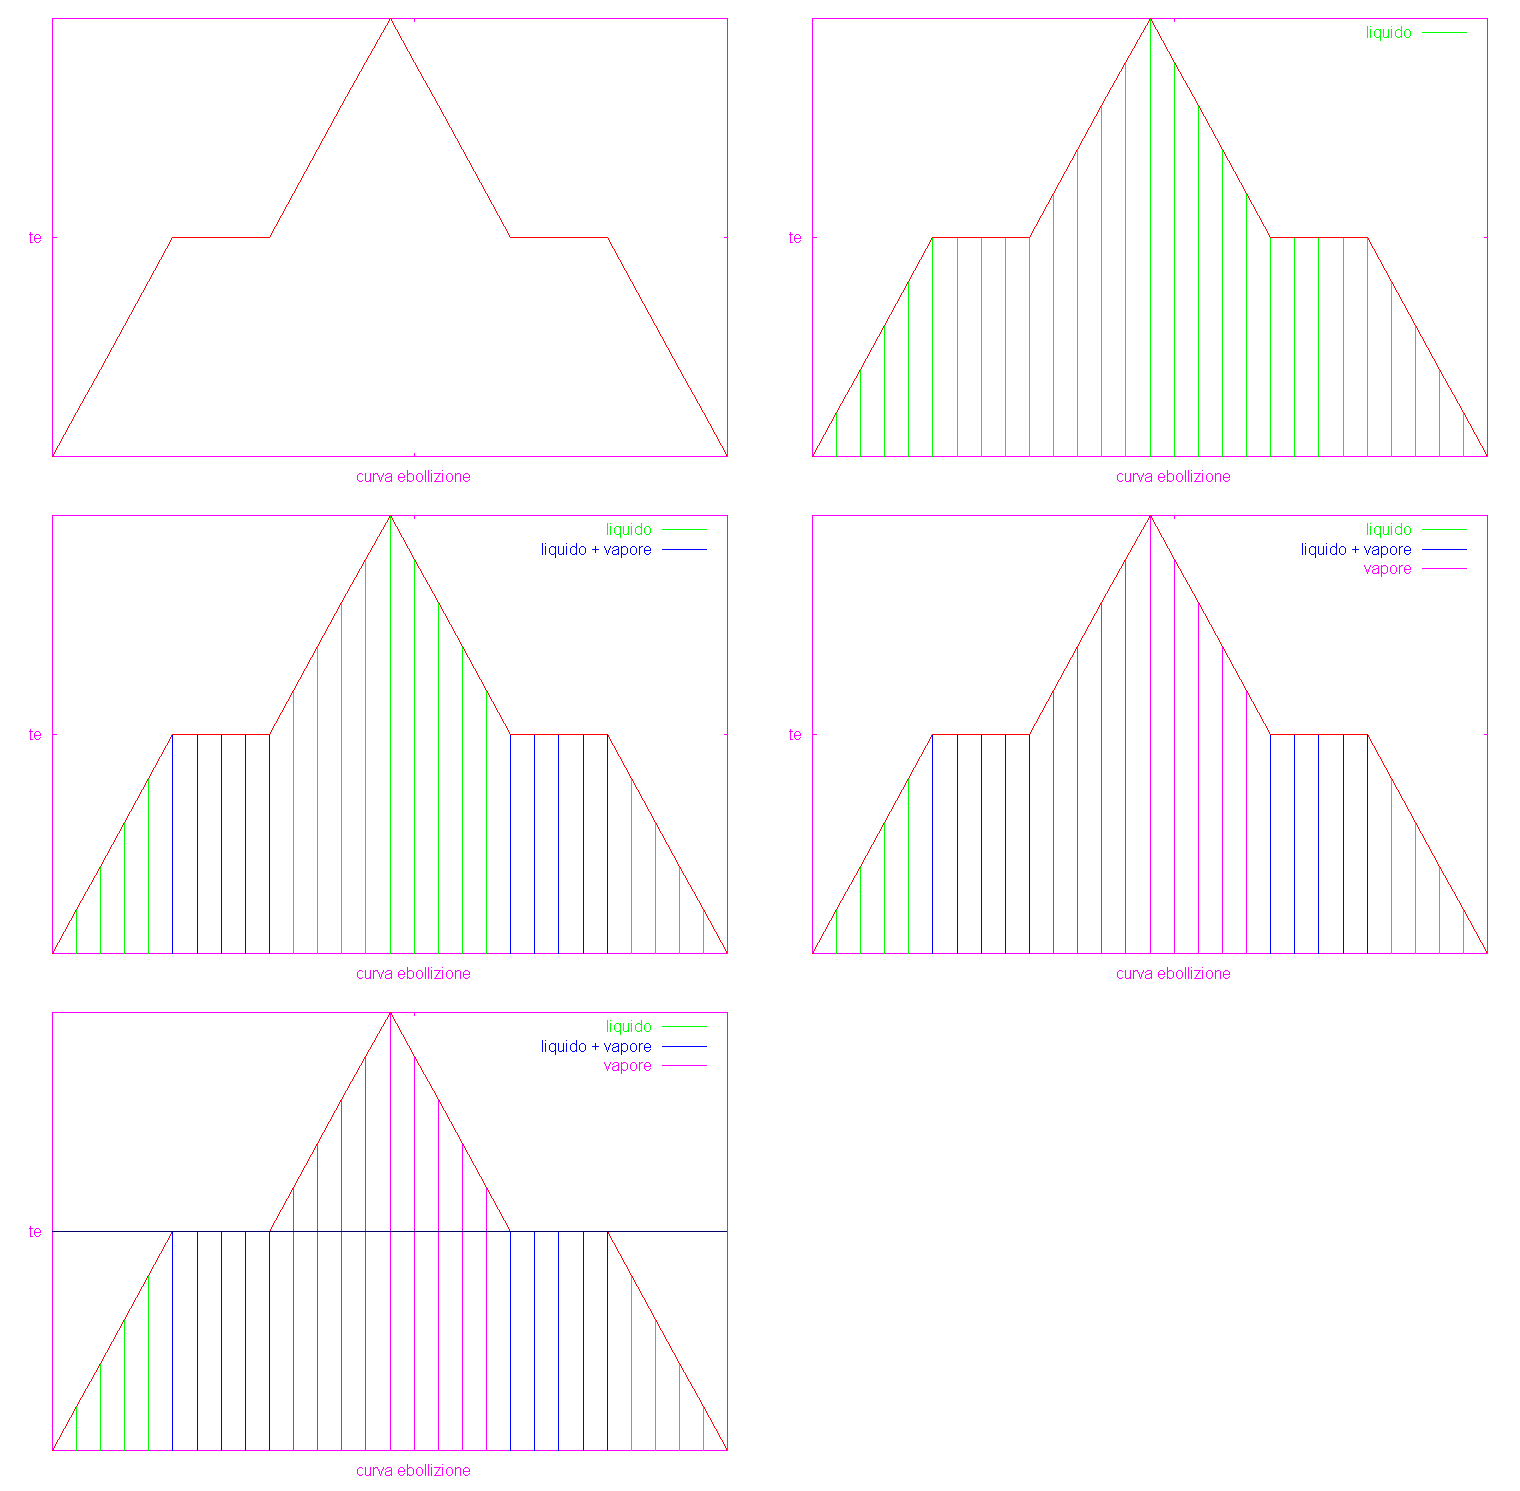
curva ebollizione
scrivere file per dati con notes
bolle.dat e richimare con plot e replot
inserire titoli
# bolle.dat
0	0
1	1
2	2
3	3
4	4
5	5	5
6	5	5
7	5	5
8	5	5
9	5	5
10	6	0	6
11	7	0	7
12	8	0	8
13	9	0	9
14	10	0	10
15	9	0	9
16	8	0	8
17	7	0	7
18	6	0	6
19	5	5
20	5	5
21	5	5
22	5	5
23	5	5
24	4
25	3
26	2
27	1
28	0
copiare e incollare su gnuplot>
set key
set xtics ("curva ebollizione" 15)
set ytics ("te" 5)
plot 'c:\provagnu\bolle.dat' using 1:2 title "" w lines 1
pause -1
replot 'c:\provagnu\bolle.dat' using 1:2 title 'liquido' w impulses 2
pause -1
replot 'c:\provagnu\bolle.dat' using 1:3 title 'liquido + vapore' w impulses 3
pause -1
replot 'c:\provagnu\bolle.dat' using 1:4 title 'vapore' w impulses 4
pause -1
replot 5 title ""
pause -1
animazione con gifanimator
