All the quantities involved in the description of motion (time, distance,
velocity and acceleration) can be resumed by using diagrams and the rules of
analytic geometry. As a matter of fact, a graph is the best way to deduce
qualitative but precise information about motion. An analysis of the following
example will illustrate this idea.
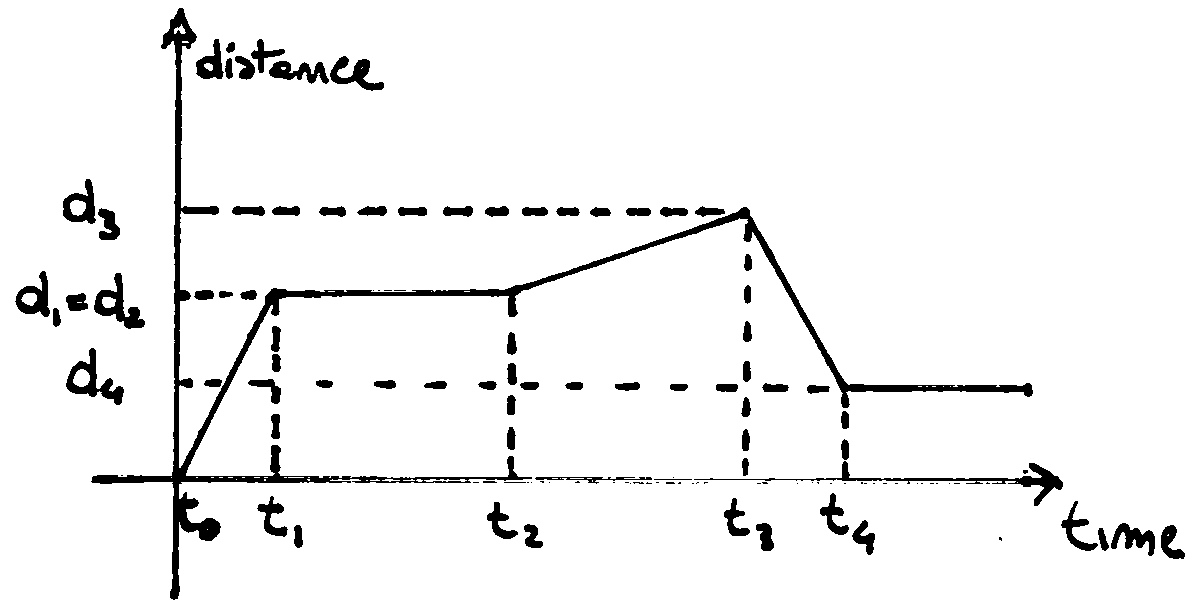
Suppose that an object moves, and its motion is recorded on the following
distance-time graph:

The graph reveals considerable information about the motion.
Between ![]() and
and ![]() (
(![]() ), the
object has a positive constant velocity: as a matter of fact its position passes
from
), the
object has a positive constant velocity: as a matter of fact its position passes
from ![]() to
to ![]() [the dotted tangent to the graph has a positive slope];
[the dotted tangent to the graph has a positive slope];
between ![]() and
and ![]() (
(![]() ), the
object is at rest. It has no velocity: as time passes its position doesn’t
change [the tangent line has no slope, the slope is equal to zero];
), the
object is at rest. It has no velocity: as time passes its position doesn’t
change [the tangent line has no slope, the slope is equal to zero];
between ![]() and
and ![]() (
(![]() ), the object moves again and
its position passes from
), the object moves again and
its position passes from ![]() =
=![]() to
to ![]() ; now its velocity is
positive again, but it is smaller than before: a longer interval of time is
needed to cover a shorter distance [the tangent line has a positive slope but it
is less steep than before];
; now its velocity is
positive again, but it is smaller than before: a longer interval of time is
needed to cover a shorter distance [the tangent line has a positive slope but it
is less steep than before];
between ![]() and
and ![]() (
(![]() ), the object turns back and
its velocity becomes negative: as time passes the position is reduced until
), the object turns back and
its velocity becomes negative: as time passes the position is reduced until ![]() [the tangent line has a negative slope];
[the tangent line has a negative slope];
At the point ![]() the object stops
short, then it remains at rest [the tangent line has no slope again].
the object stops
short, then it remains at rest [the tangent line has no slope again].
Hence it is possible to deduce the velocity by looking at the slope of the
distance versus time graph. To be more precise, the instantaneous velocity at
a given instant is the angular coefficient of the straight line tangents to the
distance versus time graph at that instant.

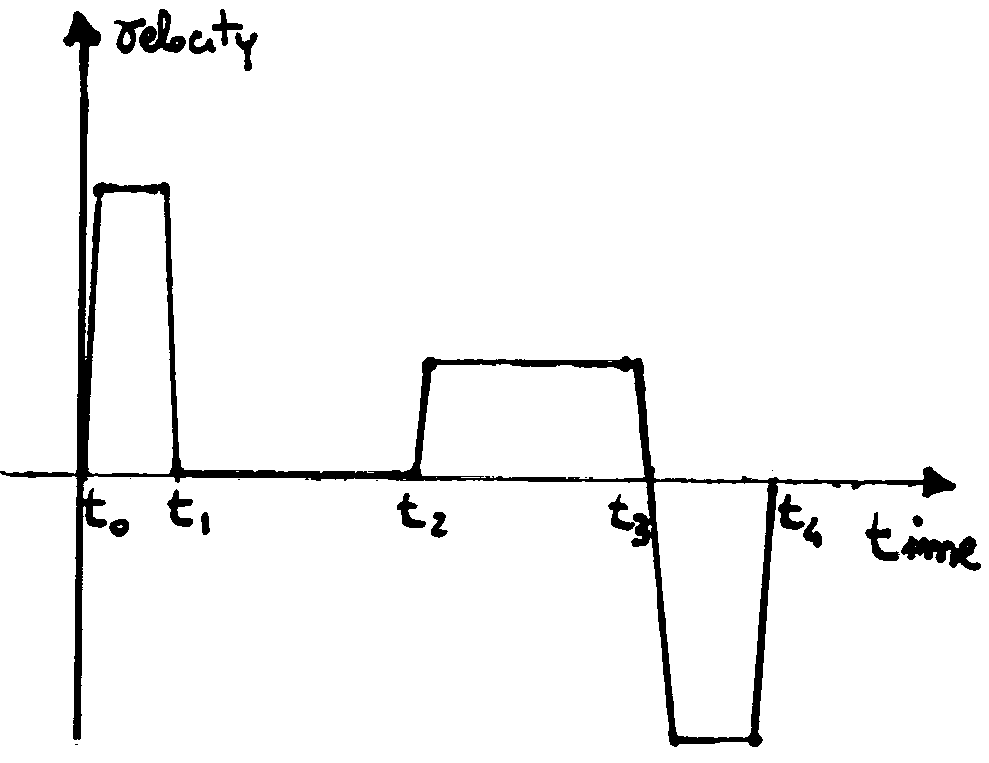
Apart from the initial instant, during which a strong acceleration takes
place, the object spends the major part of the period between ![]() and
and
![]() (
(![]() )
with a constant velocity, and its acceleration is zero (no slope). Then, at
approximately
)
with a constant velocity, and its acceleration is zero (no slope). Then, at
approximately ![]() , the object
brakes suddenly: a negative acceleration takes place (negative slope of the
tangent line).
, the object
brakes suddenly: a negative acceleration takes place (negative slope of the
tangent line).
Between ![]() and
and ![]() (
(![]() ), the
velocity is zero and acceleration is zero too.
), the
velocity is zero and acceleration is zero too.
At the instant ![]() a new and
positive acceleration lets the object pass from resting to a new constant
velocity, and so on…
a new and
positive acceleration lets the object pass from resting to a new constant
velocity, and so on…
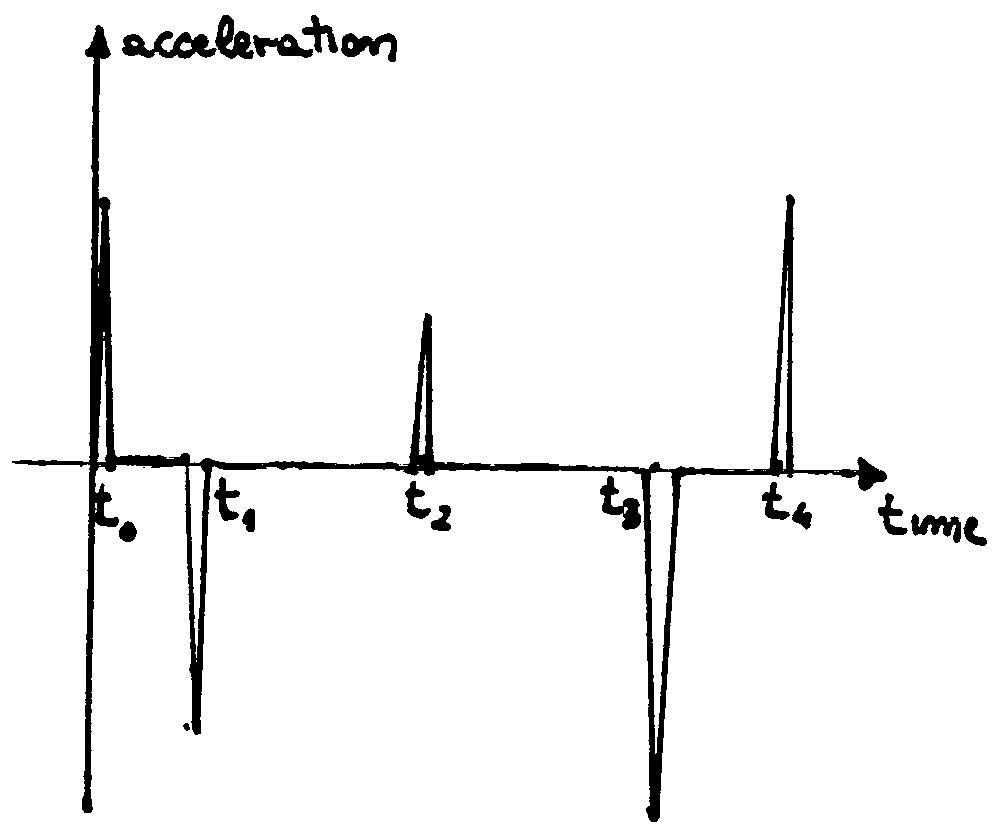
With a similar argument as before, the acceleration can be deduced by looking at
the velocity versus time graph: the instantaneous acceleration at a given
instant is the angular coefficient of the straight line tangents to the velocity
versus time graph at that instant.

Every time the velocity changes, a spike of acceleration appears in order to
justify that change. The acceleration is positive when the change in velocity
give rises to a larger velocity and vice-versa, it is negative when the velocity
changes to a smaller magnitude.
Notice that the described motion is quite complex because the acceleration
varies over time. All the motions where a varying acceleration takes place, will
be treated in our course from the qualitative point of view only. We will try to
describe mathematically only easier motions, like the uniform velocity motion or
the uniform acceleration motion.
| Next | Available exercises | Index |