| Description | Electrical schematics | Prototype measurements |
| Ritorna alla pagina iniziale | Return to English homepage |
The peak detector prototype has been tested applying to its input a 1 MHz sinewave whose amplitude has been varied, ranging from 5 mV rms to 1,5 V rms.
The maximum allowable input signal has not been checked, but it can be considered to be around 10 V rms (sinewave), taking into account the op-amp characteristics and power supply value.
All signals have been measured with a LeCroy mod. 9310A digital storage oscilloscope; rms measurements given below have been directly evaluated by the instrument, internally processing its measured signals samples.
The following table lists, for each applied input signal:
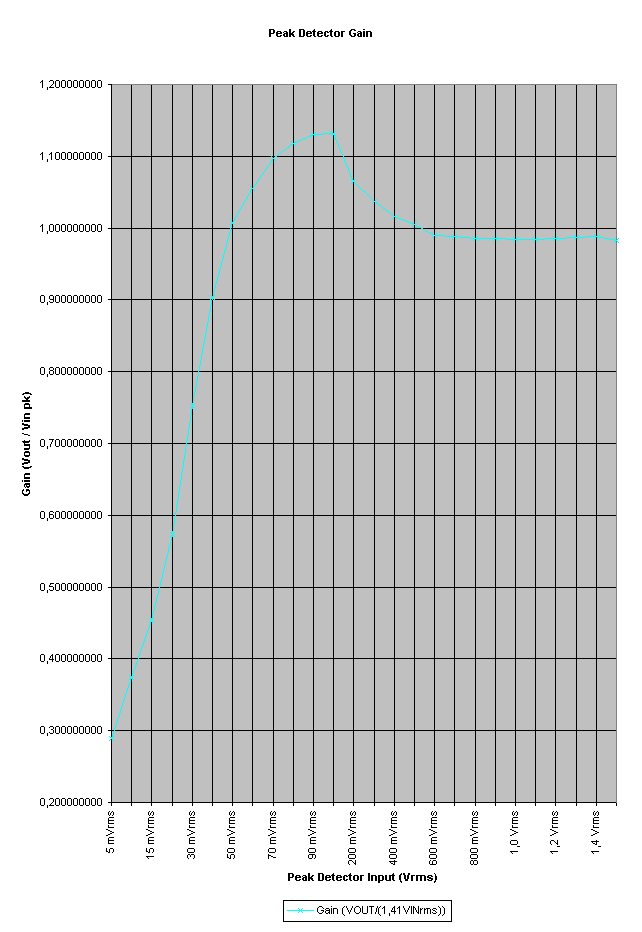
Ideal gain should be always 1, no matter the input signal level; in the real world it ranges from slightly less than 0,29 (for VIN =5 mVrms) up to a peak of 1,13 (for VIN =100 mVrms), back to slightly less than 1 for higher input levels.
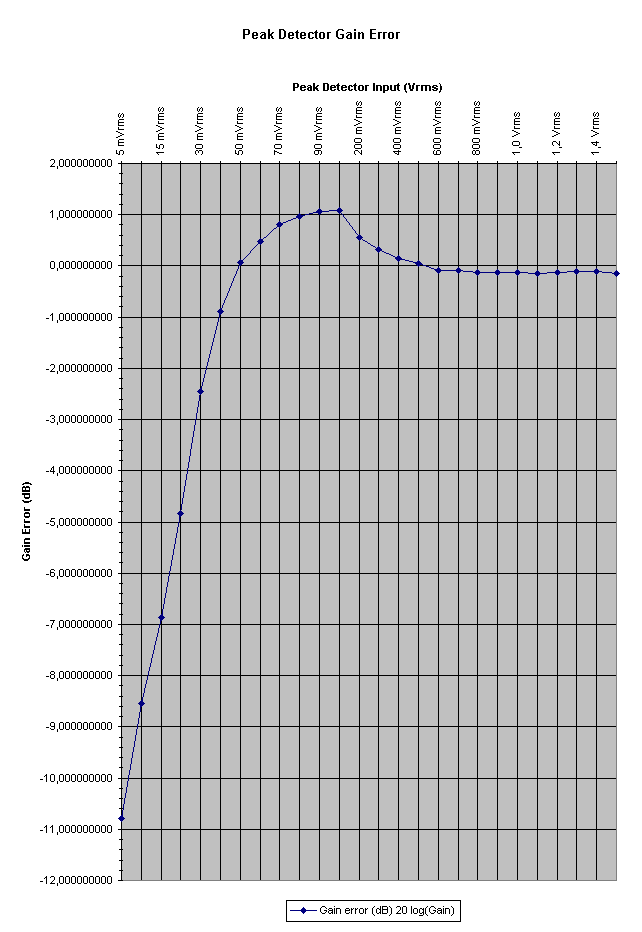
Speaking of gain error, expressed in decibels, the unit performs as follows.
| nominal input | measured input | evaluated input | measured output | Gain | Gain error (dB) |
| (VIN) | (VINrms) | (VINpk) | (VOUTDC) | (VOUT/(1,41VINrms)) | 20 log(Gain) |
| 5 mVrms | 0,00502 | 0,00710 | 0,00205 | 0,288758745 | -10,789297078 |
| 10 mVrms | 0,01010 | 0,01428 | 0,00534 | 0,373856457 | -8,545902292 |
| 15 mVrms | 0,01501 | 0,02123 | 0,00963 | 0,453660113 | -6,865388059 |
| 20 mVrms | 0,02035 | 0,02878 | 0,01649 | 0,572982350 | -4,837175115 |
| 30 mVrms | 0,03004 | 0,04248 | 0,03201 | 0,753478298 | -2,458585040 |
| 40 mVrms | 0,04001 | 0,05658 | 0,05109 | 0,902926405 | -0,886952931 |
| 50 mVrms | 0,05010 | 0,07085 | 0,07138 | 1,007450739 | 0,064476398 |
| 60 mVrms | 0,06003 | 0,08490 | 0,08963 | 1,055771794 | 0,471401105 |
| 70 mVrms | 0,07009 | 0,09912 | 0,10877 | 1,097332067 | 0,806761414 |
| 80 mVrms | 0,08013 | 0,11332 | 0,12672 | 1,118240001 | 0,970700473 |
| 90 mVrms | 0,09039 | 0,12783 | 0,14458 | 1,131026645 | 1,069456724 |
| 100 mVrms | 0,10002 | 0,14145 | 0,16010 | 1,131851586 | 1,075789678 |
| 200 mVrms | 0,20040 | 0,28341 | 0,30180 | 1,064894344 | 0,546130408 |
| 300 mVrms | 0,30090 | 0,42554 | 0,44140 | 1,037277944 | 0,317902865 |
| 400 mVrms | 0,40070 | 0,56668 | 0,57570 | 1,015925565 | 0,137237784 |
| 500 mVrms | 0,50000 | 0,70711 | 0,71040 | 1,004657315 | 0,040359012 |
| 600 mVrms | 0,60240 | 0,85192 | 0,84280 | 0,989292157 | -0,093508682 |
| 700 mVrms | 0,70200 | 0,99278 | 0,98160 | 0,988740764 | -0,098351205 |
| 800 mVrms | 0,80150 | 1,13349 | 1,11690 | 0,985361901 | -0,128084672 |
| 900 mVrms | 0,89700 | 1,26855 | 1,24940 | 0,984904362 | -0,132118785 |
| 1,0 Vrms | 1,00130 | 1,41605 | 1,39400 | 0,984427098 | -0,136328805 |
| 1,1 Vrms | 1,10080 | 1,55677 | 1,53130 | 0,983641546 | -0,143262724 |
| 1,2 Vrms | 1,20150 | 1,69918 | 1,67380 | 0,985064778 | -0,130704189 |
| 1,3 Vrms | 1,30710 | 1,84852 | 1,82560 | 0,987601668 | -0,108363708 |
| 1,4 Vrms | 1,40190 | 1,98259 | 1,95860 | 0,987901663 | -0,105725668 |
| 1,5 Vrms | 1,49600 | 2,11566 | 2,07800 | 0,982197788 | -0,156020963 |


Data ultimo aggiornamento 26/06/99
Aggiornato da Piero Montanari
Indirizzo di posta elettronica: bin8829@iperbole.bologna.it