Atomic
oxygen transitions 3s5S2 → 3p5PJ
with J=1, 2, 3 levels have been observed by using a
commercially available AlGaAs double
heterostructure diode laser (DHDL) and the frequency modulation (FM)
technique.The level positions
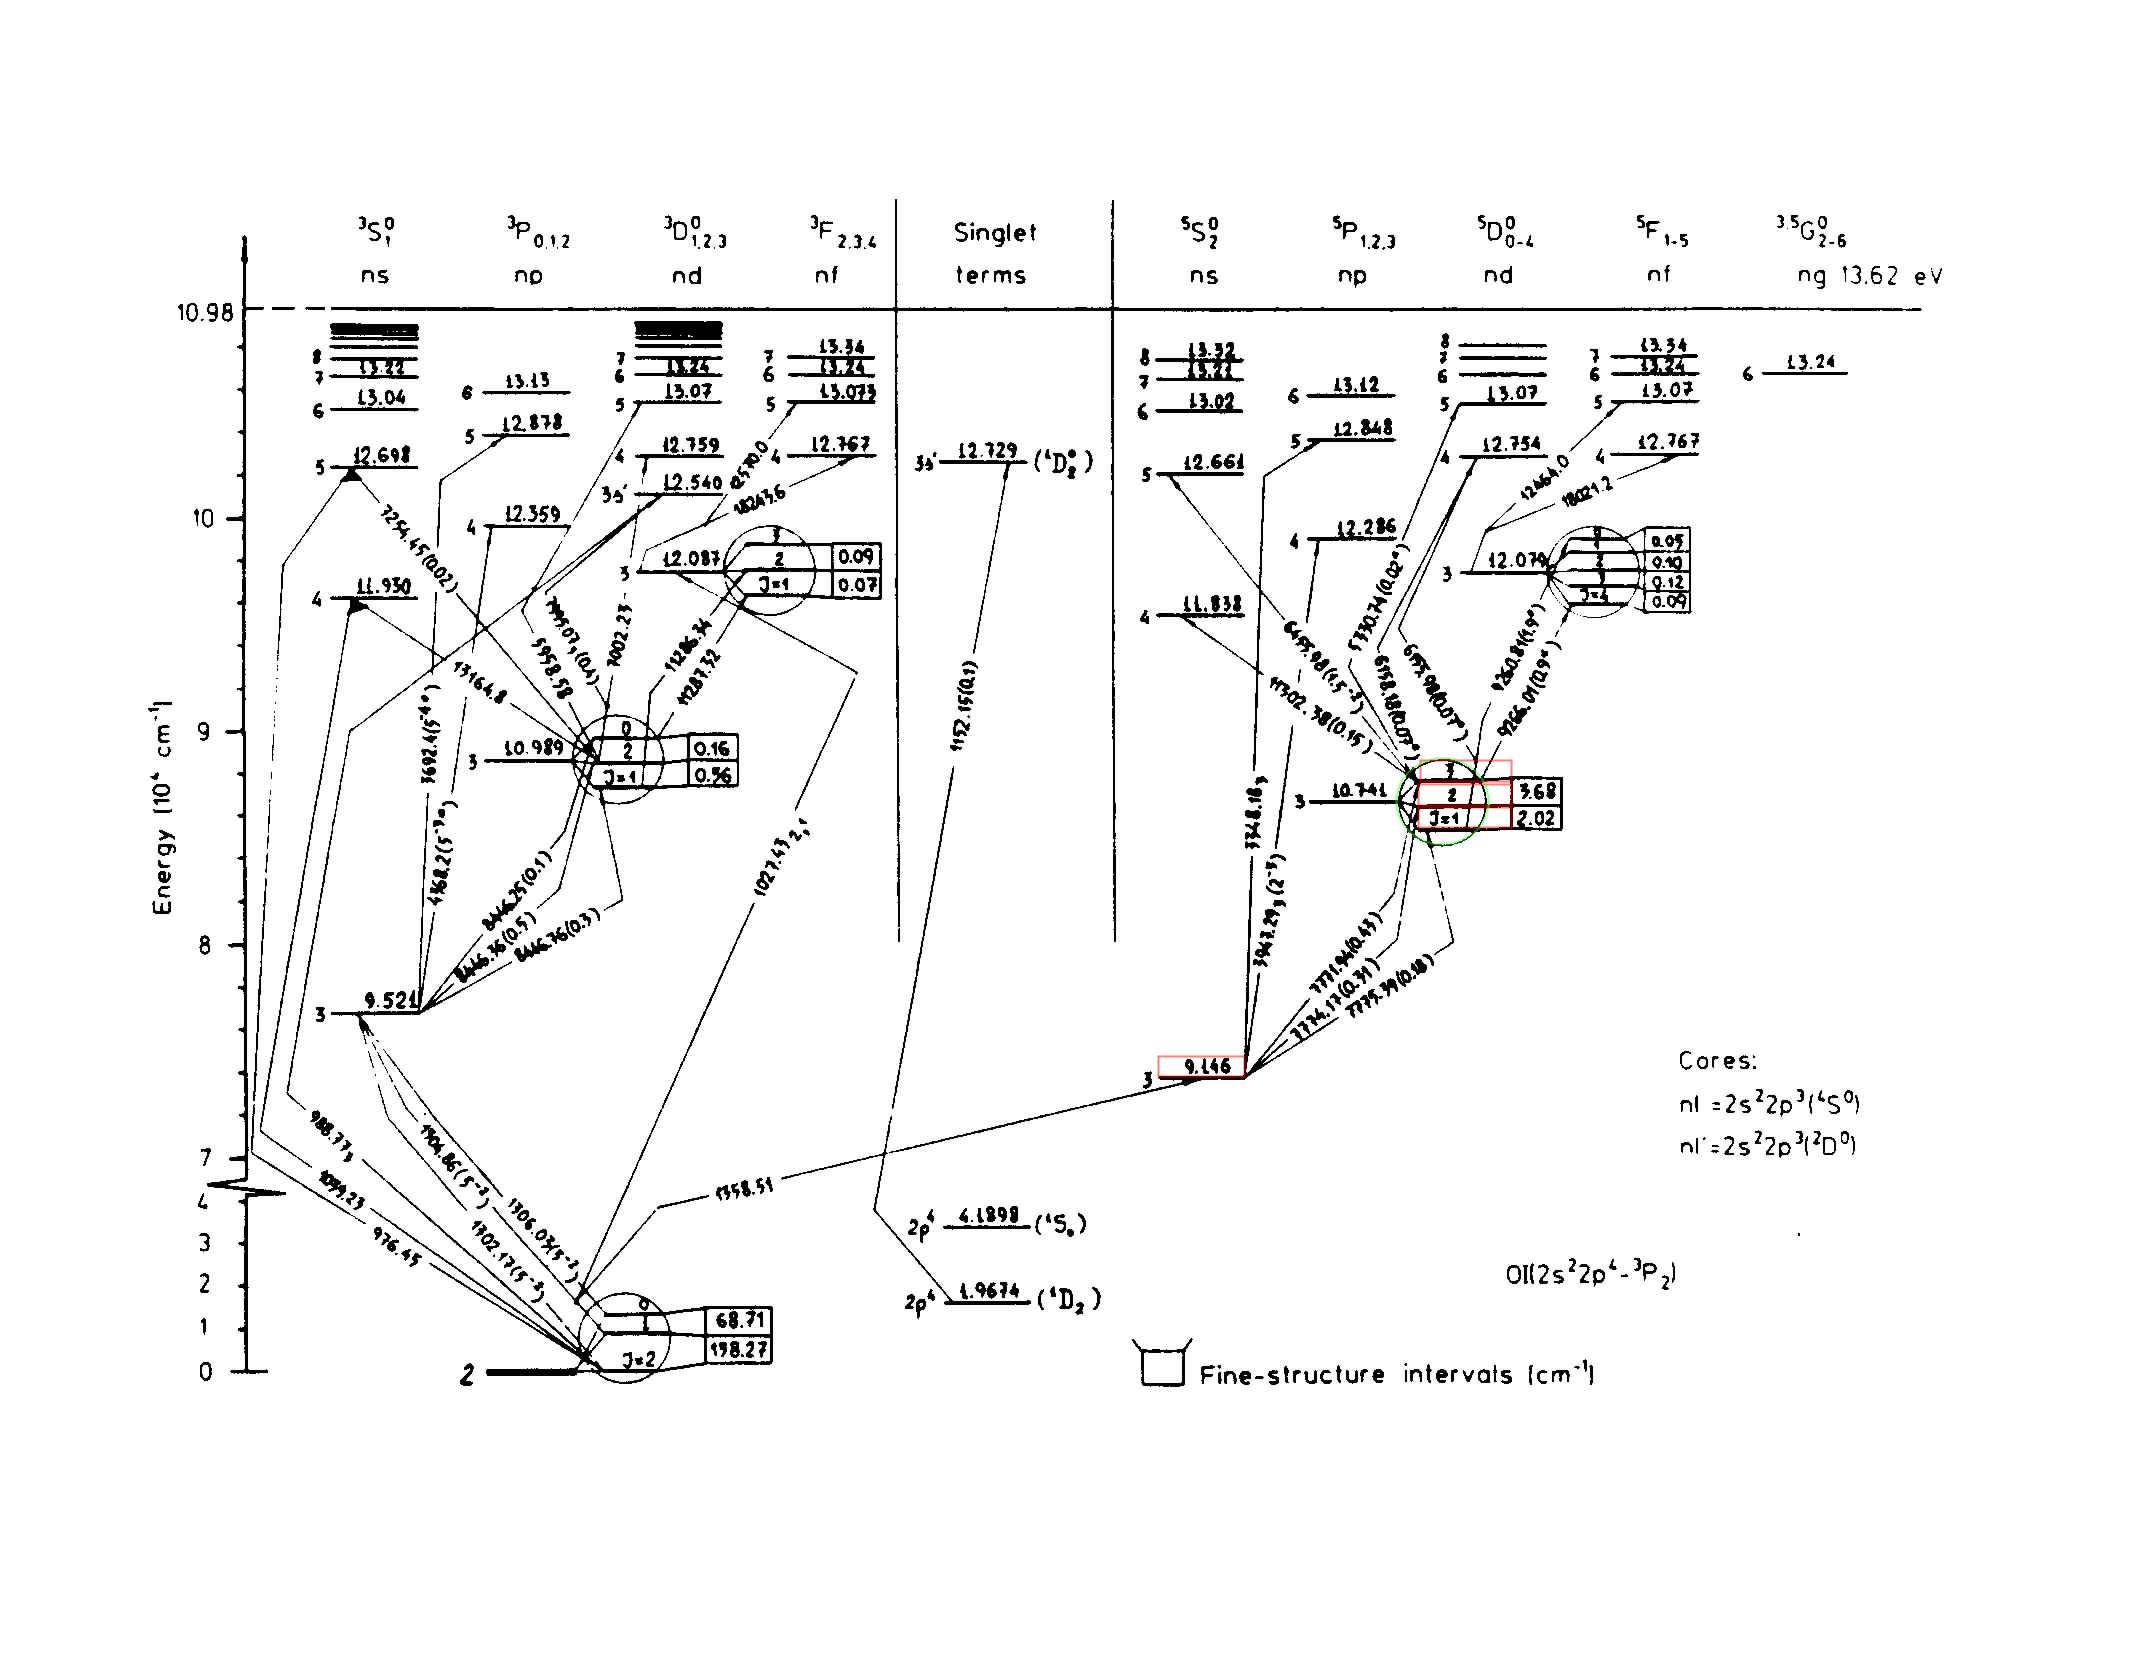
schematic for atomic oxygen is shown in Fig. 1.
Fig.
1.Grotrian diagram for atomic
oxygen with fine-structures and absorption oscillator strengths.
ARF has been used to dissociate the oxygen molecule
and to populate the 73768.200 cm-1(9.146 eV)
starting level. We used a RF oscillator tube RCA 829 B giving a few
Watt at ~75 MHz.
Experimental
apparatus.
Fig. 2.
Sketch of the experimental apparatus. TDL: diode laser; B.S.:
beam-splitter; D: detector; F.P.: Fabry-Perót
interferometer; PC: personal computer; M: monochromator; O.I.:
optical insulator.
The
experimental apparatus uses a single mode both transversely and
longitudinally diode laser Mod. SHARP LT024MD as source. It emits at
~779 nm at RT with a linewidth of ~25-30 MHz, as it can be seen in
Fig. 3 by its transmission by the 75 MHz f.s.r. Fabry-Perót
interferometer.
Fig.
3. Fabry-Perót
transmission (f.s.r.= 75 MHz) of the SHARP diode laser used in this
work.
The current is driven by a stabilized low-noise
current generator, which permits also the scan of the emission
wavelength by mixing to the driving current an attenuated low
frequency (~1 Hz) sawtooth signal. The DL is temperature regulated
within 0.002 K by a Peltier junction driven by a high stability
temperature controller. In front of the DL an optical insulator
prevents back-scattered light to influence the stability of the laser
it-self.
The measurement cell used is a Pyrex
cylindrical one, 13 cm long and 5 cm in diameter. A confocal 5 cm
Fabry-Perót
interferometer is adopted to mark the frequency scan and to check the
goodness of the DL emission. A monochromator is employed for the
rough wavelength reading.
For the in-phase detection a sinusoidal
modulation at a frequency of 5 KHz is added to the DL injection
current. The transmitted power is collected by silicon photodiodes
and sent to a lock-in amplifiers in order to extract the second
harmonic signals. The result is the second derivative of the
absorption feature with a good signal to noise ratio and a flat
baseline.
By using the mirror at the end of the
measurement cell we can make the light to come back through the very
same path in order to show the “lack-of-absorption” in
the Doppler-free spectroscopy.
The RF is generated by the mentioned vacuum
tube powered by a Philips PE 4831 power supplier and it is coupled to
the cell by a coil, as shown in Fig. 2.
Experimental
results.
Fig.
4. Second derivative of the atomic oxygen absorption line at 777.54
nm (J=1). The oxygen partial pressure was ~20 mtorr and the optical
path length was 26 cm. The amplifier bandwidth was 3Hz.
The sub-Doppler configuration permitted to observe resonance
lines as narrow as 150 MHz, as shown in Fig. 4. Even in free-running
mode the diode laser spectroscope can measure the spin-orbit
splitting by an error of a few thousandths of wavenumber (resolving
power ~3·106) as shown in the following figure.
The known wavenumber distance between the J = 1 and J = 2 fine
structure lines is 2.021 cm-1 (NIST). Our measurement
gives 2.018 cm-1 with an error of 1 σ = 0.004 cm-1.
Fig.
5. Second derivative of the atomic oxygen absorption transition
around 777.5 nm starting from the 3s5S2 level.
The measurement has been done in air at ~100 mtorr. The lock-in time
constant was 12.5 ms (10 Hz band-pass).