ALPO Feature:
The Nature of the Hook-Like Shadow on Plato’s Floor
Observed by Wilkins and Moore in 1952
Part II. Simulations with a Computer and a Plasticine ® Model
By: Giancarlo Favero a , Raffaello Lena b , Fabio Lottero b and Marco Fiaschi c
a Osservatorio Guido Ruggieri, Padova, Italy
b GLR, Geologic Lunar Researches, Italy
c Osservatorio Giuseppe Colombo, Padova, Italy
Introduction
A paper recently appeared in this Journal [1] which proposed that the hook-like shadow recorded on the floor of the lunar crater Plato by Wilkins and Moore on 1952 April 3, [2, 3], is projected by a complex and elongated hill lying on Plato’s floor, at the foot of its south wall.
The hill is easily visible on Lunar Obiter IV images [1]
and has coordinates
eta = 0.7693, xi = –0.0875 (latitude 50.29°, longitude
–7.87°). Some Italian authors [4] and an ALPO editor [5] maintained
another opinion expressed by O’Connell in 1998 [6], that the hook shadow
is shed by the gamma peak (peak #3 in paper [1]), the tallest of the Plato’s
east rim peaks.
We carried out a computer simulation of the 1952 drawings and built a Plasticine ® model of Plato in order to demonstrate that:
• The hook-like shadow recorded on the Wilkins and Moore drawings is compatible with the shadow of the complex and elongated hill, as suggested in paper [1].
• The gamma peak shadow cannot appear where the hook-like shadow is reported in the drawings, regardless of the illumination conditions.
• The gamma peak shadow never displays significant curvature so it cannot be the hook shadow.
Experimental
A. Computer Simulation of the
1952 Shadows
The original two Plato drawings made on 1952 April 3, 21 h 30 m UT [2, 3] are reproduced here as Figures 1 and 2. Each one was scanned and digitally converted to obtain the contour of: the crater rim, the hook-like shadow, the shadow cast on Plato’s floor by its east wall, the shadows of a few features lying on Plato’s east wall and the shadows of a few features lying outside Plato’s wall. We selected for our simulation only those features of the last two types which were identifiable in both drawings.

Figure 1: Plato drawn by H. P. Wilkins on 1952 April 3, at 21h30m UT, observing the Moon with the Meudon grande lunette of 83 cm (altitude of the Sun over Plato, H = 5.32°; azimuth of the Sun, A = 94.95°). The hook-like shadow near the south-east wall is evident. South is up, or nearly so, in all the figures.
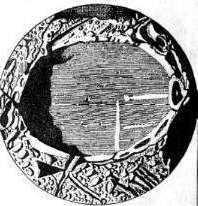
Figure 2: Plato drawn at the same time as Figure 1 by P. Moore, observing with the same instrument. Features on Plato’s floor are similar, in particular the "hook", while those outside the crater are crudely different, revealing that the authors were concerned with few features on the floor.
The digital image of each drawing was measured on the computer screen to obtain, in units of pixels, the length of Plato's major and minor axes. Along the same two directions, identified by the same geological features, we measured the corresponding diameters of Plato on the image IV-127-H3 taken by Lunar Orbiter IV 1967 May 20, 6 h 26 m UT (Sun’s height over Plato, H = 20.79°; Sun’s azimuth, A = 117.47°). The digital image of each drawing was then stretched and rotated to give the best superimposition over the Lunar Orbiter image. It is worth noting that the hook-like shadow was not considered in these operations. The best fit obtained with this procedure is shown in Figure 3 for the Wilkins drawing and in Figure 4 for the Moore drawing.
B. The Plasticine ® Model
A 6 inch diameter (150 mm) 3-D model of Plato’s east wall and floor (Figure 5), at the scale of about 1:670.000, was built by layering Plasticine ® over a copy of the Lunar Orbiter photo described above.
The height in kilometres of different portions of Plato’s east wall was calculated with the ALPO Lunar Observer’s Tool Kit software from the relevant shadow lengths measured in units of pixels on Figure 3 of [1] and is reported in Table 1.
The height of each measured portion of Plato’s east wall, resampled with the proper scale ratio, was built up with Plasticine ® . The height was determined with a centesimal calliper (0.05 mm precision, corresponding to 33 m, or 106 ft, on the Moon). Each calibrated portion was then connected to the nearby ones so as to obtain shadows like those recorded on the CCD images taken under similar lighting conditions. The slope of Plato’s inner wall was obtained by connecting the wall rim with the scarp base recorded on the Lunar Orbiter photo. The Moon's curvature was neglected.

Figure 3: The best fit between some shadows of the Wilkins’s drawing (reticulated) and the corresponding features on the Lunar Orbiter IV image IV-127-H3
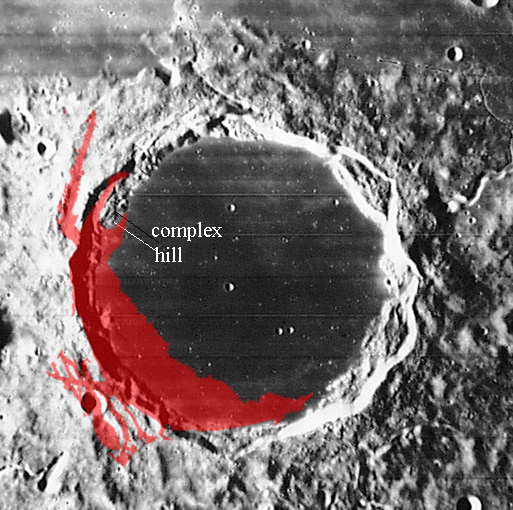
Figure 4: The best fit between some shadows of the Moore’s drawing (reticulated) and the corresponding features on the Lunar Orbiter IV image IV-127-H3
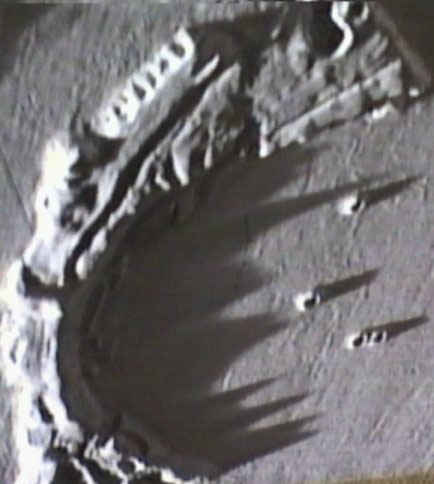
Figure 5: The
Plasticine® model built for this work. The lighting is similar to O’Connell’s
image [4] and to Figure 3 in [1]: H = 3°; A = 95°.
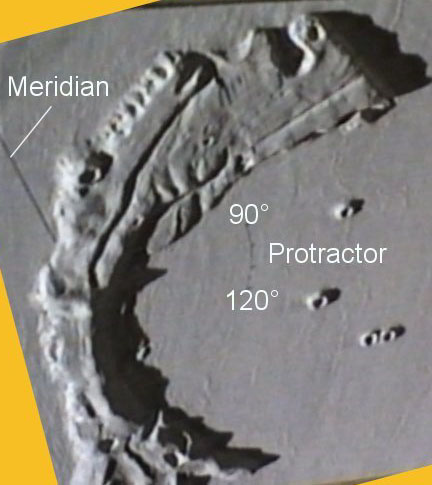
Figure 6: Plato’s model illuminated like the CCD images of Figures 6 and 7 in [1]: H = 11°; A = 105°. The meridian passing through the gamma peak, the 90°-120° protractor and the hook-like shadow are indicated.
The white-painted model was placed in a dark room, illuminated by a beam of sunlight, and photographed with a camcorder. Different sequences were recorded modifying the Sun’s height and azimuth. A few frames of suitable sequences were digitally converted and they are shown as Figures 5-7.
We included some key geological features on this model (Figure 6). First, we put the complex and elongated hill proposed in [1] as the cause of the hook-like shadow, adopting a height of 500 m (1550 ft) measured by its shadow in Figure 7 of [1] and calculated with the ALPO Lunar Observer’s Tool Kit software (Table 2). A few smaller hills lying on Plato’s floor at the foot of its east wall were also included, to improve the shadows’ contour for the Sun’s height around 10°. The four craterlets reported on the 1952 drawings were also added to the model, with exaggerated wall heights. Also, we added to the model (Figure 6) the meridian passing through the gamma peak and a protractor arc, with its center on the gamma peak, to indicate the Sun's azimuth, referred to the same peak, from 90° to 120° in 5° increments.
Results and Discussion
A. Computer elaboration of the 1952 shadows
The digital copies of the 1952 drawings were computer resampled to simulate Plato’s perspective as shown in the IV-127-H3 Lunar Orbiter IV photo. Each resampled drawing was then superimposed on that photo to give the best fit between a few selected features appearing on both pertaining to Plato’s wall rim and the neighboring terrain. The hook-like shadow was deliberately neglected in this procedure, so its final position was only the result of the best fit among the other selected features. The results are reported in Figures 3 and 4 which show the shadows from Wilkins and Moore, respectively, superimposed on the Lunar Orbiter photo IV-127-H3. In both figures the hook-like shadow closely encircles the north-west base of the complex and elongated hill, as one would expect if the hill is the source of the hook, as suggested in paper [1].
B. The Plasticine ® Model
The fidelity of our Plato Plasticine ® model (Figure 5) is demonstrated by its ability to simulate fairly well the shadows appearing in the O’Connell CCD image [6] and in Figure 3 of paper [1]. An interesting result provided by the model is that the complex and elongated hill, proposed in paper [1] as the source of the hook-like shadow, can actually cast a shadow of that geometry in the correct position, as Figure 6 clearly shows (compare Figure 6 with Figures 1 and 2).
Table 1: Coordinates, shadow lengths
and peak heights of peaks 1 through 9 from Figure 3b of article [1]. For
some of the valleys (a-h) eta values are also reported, but not their xi
values, because the position of the highest feature on the bottom of a
valley can differ considerably at different sunlight inclinations.
| Peak (1,2 …) valley (a,b ...) | eta | xi | Shadow (pixel ±1) | Height
(km ± 0.03) |
| a | 0.7683 | 40 | 1.29 | |
| 1 | 0.7700 | -0.0822 | 43 | 1.39 |
| 2 | 0.7715 | -0.0800 | 47 | 1.52 |
| b | 0.7723 | 40 | 1.29 | |
| 3 | 0.7724 | -0.0759 | 65 | 2.10 |
| c | 0.7750 | 37 | 1.20 | |
| 4 | 0.7800 | -0.0727 | 46 | 1.49 |
| d | 0.7814 | 40 | 1.29 | |
| 5 | 0.7830 | -0.0719 | 49 | 1.58 |
| 6 | 0.7859 | -0.0716 | 53 | 1.71 |
| e | 0.7886 | 30 | 0.97 | |
| 7 | 0.7905 | -0.0729 | 39 | 1.26 |
| f | 0.7921 | 32 | 1.03 | |
| 8 | 0.7941 | -0.0748 | 40 | 1.29 |
| g | 0.7959 | 30 | 0.97 | |
| 9 | 0.7968 | -0.0769 | 35 | 1.11 |
| h | 0.7986 | 33 | 1.07 |
| Peak | eta | xi | Shadow
(pixel ± 1) |
Height
(km ± 0.03) |
| ch | 0.7693 | -0.0875 | 3 | 0.50 |
A further result concerns the gamma peak shadow (peak and shadow #3 in paper [1]). The gamma peak's shadow is the longest shadow, measured from the east wall rim to the shadow's tip, on Plato’s floor under any lighting condition. It should coincide with the 1952 hook as proposed by O’Connell only for solar azimuth values lower than 80°. This azimuth of 80° is the azimuth simulated in Figure 7, where the gamma peak shadow is cast near the elongated hill in which case it appears similar to the 1952 hook. But an azimuth of 80° is clearly impossible, so the gamma peak shadow can NEVER be in the place of the 1952 hook. While the Sun rises over the gamma peak, its shadow on Plato’s floor shortens and shifts north-ward, because of the rising of Sun and because of its increasing azimuth. This is confirmed by the image IV-116- H1 of Lunar Orbiter IV taken 1967 May 19, 7h00m UT (H = 15.71°; A = 109.02°) and reported here as Figure 8.
Figure 8 shows the gamma peak shadow in a position more northern than the 1952 hook. Moreover, Figure 8 shows the top of the complex and elongated hill near the Plato’s southern wall: the top of the hill is illuminated by the Sun. The north-western base of the hill is encircled by shadows recorded by Lunar Orbiter. These shadows cannot be seen with the same resolution by an earth based observer. Integrated by an earth-based observer, these shadows combine to give the hook.
Why is the gamma peak shadow not reported on the 1952
drawings?
If what precedes is correct, we must search for an answer to this question.
We think that the two Plato drawings made at the telescope on 1952 April 3 by the two English observers were originally only rough and incomplete sketches of a few features upon which their attention was directed.
This hypothesis is supported by their words [2, page 236]: "The shaded drawing [of Plato reported on page 234] …. may be relied upon as depicting, with accuracy, the relative size and intensities of the cratercones, spots and streaks (?) visible under that particular angle of illu-mination."
The question mark concerns the absence of any streak from the Wilkins drawing (Figure 1), while three streaks are well evident in the Moore drawing (Figure 2). We can thus maintain that the observers recorded at the telescope only these few features, including the hook-like shadow, which appears similarly in the two drawings. Completing from memory their drawing in a later time, the two observers forgot to report the gamma peak shadow (probably confounding it with the hook) and introduced a considerable amount of rough differences in the Plato’s neighborhoods, which can be seen by comparing features between Figure 1 and 2.
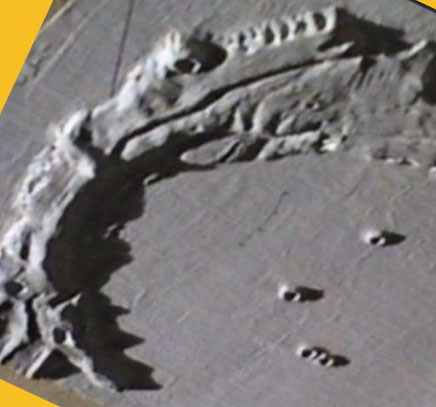
Figure 7: The gamma peak’s shadow would combine with the complex and elongated hill’s shadow only for a Sun’s azimuth of 80° and 10° Sun’s height. Only thus the model would be similar to the 1952 drawings, but this azimuth is impossible.
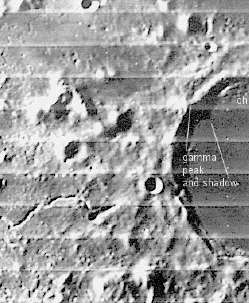
Figure 8: Image IV-116-H1 of Lunar Orbiter IV taken 1967 May 19, 7 h00 m UT (H = 15.71°; A = 109.02°). The gamma peak shadow is well visible, northward of the curved shadow of the complex and elongated hill (ch), which appears like the hook shadow of the 1952 drawings.
This hypothesis is sustained by the following recon-struction of the 1952 April 3 minimal observing schedule based on "The Moon" [2] even though a precise time scale is lacking:
• Wilkins "saw a distinct craterlet on the summit of the central mountain [of Alpetragius], surrounded by four almost overhanging peaks. This was at once confirmed by Moore… (page 138).
• Wilkins "critically examined Conon…". It follows a detailed description of the observed features (page 94).
• Moore … noted ten objects on the floor [of Archimedes], only four of which appeared as dis-tinct
craterlets." It follows a detailed description of the observed features (page 92).
• Wilkins and Moore "discovered … a white, very shallow crater within which is a most minute cen-tral pit, the whole strongly resembling a "wash-bowl" (page 228).
•At 21h30m UT the observers sketch Plato at the same time (page 234).
• Between 22h00m and 22h15 m UT Wilkins draws Guerické (page 127).
•At 22h15m UT Moore "first distinctly sees a craterlet where A and Birt join…" (page 140, the year "1951" reported on the figure caption is clearly a misprint, as confirmed by the accompanying text which states that the observation was done on "3 April 1952".)
The two observers studied Plato for not more than 30 minutes, 15 minutes each one, to cover all of those observations. It appears impossible that an observer, even an expert, could complete at the telescope a drawing as detailed as the ones in Figure 1 or 2 in this little time.
In conclusion, we suggest that the 1952 drawings contain a number of common features which attracted the attention of both observers. These certainly include the hooked shadow, whose shape and position seem accurate under the limits of a visual observation. All other features, particularly those outside Plato but also some shadows on Plato’s floor (as we will show later), have only a vague counterpart in reality.
Comparing the 1952 Drawings
with a Similar CCD Image
Figure 9 allows a comparison between the 1952 drawings and a CCD image (Figure 4 in [1]) taken under nearly the same illumination conditions: H = 5.32° in the drawings and 5.15° in the CCD frame; A = 94.95° in the drawings and 98.59° in the CCD frame. The reported values are referred to the top of the gamma peak.
The shadow cast by Plato’s east wall onto its floor
appears much more extended in the drawings than in the
CCD image, particularly in its northern half. This fact in
itself suggests a time for the drawings earlier than
21h30 m UT. However this cannot be true, because the mean height
of the east wall mountains diminishes northward (Table
1). This is confirmed by all the images reported in
[1], also those added by the ALPO editor. It can be concluded
that the shape and extension of the shadow of the
Plato east wall which appear in the 1952 drawings
were not recorded at the telescope. Therefore this
shadow cannot be relied upon.
As far as the hook-like shadow is concerned, Figure
9 reveals that it appears more eastward in the
drawings, particularly in the Moore one, and more
southward than
the gamma peak shadow in the CCD image. We are sure
that the hook was recorded accurately by the two observers
in their 1952 drawings, so that three conclusions may
be drawn:
• The time of these drawings may be later than 21h30m UT (according to Moore, as reported in [1]).
• The hook-like shadow cannot be identified with the gamma peak shadow, because of the different position of these two features.
• The gamma peak shadow doesn’t show any "hook" curvature in the CCD image, which has a very high quality (pixel scale about 0.8 km).
Now we wish to compare, in Figure 9, the portion
of the shadow between the hook (or the gamma
peak shadow) and Plato’s south wall.

Figure 9: Comparison
between the 1952 drawings and a CCD
image taken under similar light conditions (H = 5.15°;
A = 98.50°). The CCD image shows the westward extension
of the shadow south of the gamma peak’s
shadow, while
the shadow’s portion south of the hook is restricted
toward east.
The CCD image shows that this portion
of the shadow is much extended westward, so as to largely extend beyond
the longitude of the shadow tip
of the gamma peak. On the opposite case, the drawings
show that the shadow between the hook and the south
wall is strongly receded eastward. This should confirm
that the drawings were made considerably later than the
time recorded, but the situation isn’t so simple.
If Plato’s floor was perfectly flat in the region under
examination, the shadow width should have receded
regularly with the Sun’s rising, nearly maintaining its
original western profile. In other words, the portion
of shadow between the south wall and the hook
(or the gamma peak shadow) should have maintained
a larger
extension westward of the hook-like shadow (or the
gamma peak shadow). We are convinced that the strong
eastward shift of the shadow south of the hook in the
1952 drawings is due to the emersion of the complex
and elongated hill (height about 500 m, 1550 ft) from
the east wall shadow, as shown in Figure 8. By now
the hill casts his shadow westward originating the
hook-like shadow, while the gamma peak shadow
continues to be visible, more northward than the hook
and progressively confused with the inner portions
of Plato’s east wall shadows. This happens when
the Sun’s height over Plato’s gamma peak exceeds about
8°, i.e., just after 24h UT on 1952 April 3, when
the Moon was about 20° high
over the Meudon horizon.
Conclusions
The Plato drawings made by Wilkins and Moore on
1952 April 3 show crude differences between them and
a similar CCD image as far as the crater neighborhoods
are concerned. To explain these differences we suggest
that the English observers each executed at the telescope
only a partial drawing intended only to record a few features
on Plato’s floor, including the hook-like shadow
which appears similarly recorded by both. On this basis
we try to explain also the absence from the drawings of
the gamma peak shadow and the anomalous shape of the
east wall shadow, which was recorded by a CCD in similar
lighting conditions.
Computer simulations of the features similarly recorded on the 1952 drawings, including the hook-like shadow, allowed their comparison with the IV-127-H3 Lunar Orbiter IV image. Figures 3 and 4 sustain the hypothesis that the hook shadow is cast by the complex and elongated hill situated on the crater floor, near its south wall, as suggested in [1]. Accordingly, we can also explain the rapid receding of the shadow comprised between the hook and Plato’s south wall.
Our Plasticine ® Plato model, illuminated under different Sun conditions, sustains this hypothesis and discards the involvement of the gamma peak shadow in the formation of the hook. In fact, the gamma peak shadow remains visible, but sensibly northward of the hook, in any lighting condition from H = 3° and A = 94° to H = 11° and A = 105°, simulated by our model, and certainly up to H = 13.93° and A = 107.27° of the Lunar Orbiter IV image IV-116-H1.
References
[1] Favero, G., Lena, R., Mengoli, G., Cipolat, A. &
Gualdoni, P., "The Nature of the Hook-like Shadow
Observed by Wilkins and Moore on Plato’s Floor in
1952", Journal of the Assn. of Lunar & Planetary
Observers, Vol. 42, 2000, number 3, pp. 126-131.
[2] Wilkins, H. P. & Moore, P., The Moon, 2nd Ed., Faber and Faber Ltd, London, 1961, p. 236 (Wilkins drawing).
[3] Wilkins, H. P., Our Moon, Frederick Muller Ltd, London, 1958, p. 70 (Moore drawing).
[4] Braga, R. & Ferri, F., "Plato Hook: l’Uncino di Plato", http://www.uai.it/sez_lun/hook.htm
[5] "Three Additional Views of the ‘Hook’ Shadow on Plato's Floor", Journal of the Assn. of Lunar & Planetary Observers, Vol. 42, 2000, number 3, p. 132.
[6] O’Connell, B., "Plato Hook. Clementine and CCD
images shed light on the shadowy mystery of a 45 year
old drawing", Proceedings of the 49 th Convention of the
ALPO, Atlanta, Georgia, July 9-11, 1998, ALPO Mono-graph
No 8.
Note on Figures 1 and 2
Wilkins’s and Moore’s drawings (Figures 1 and 2) can be reproduced without permission from the publishers because:
1. The Faber and Faber Editor no longer holds the
"The Moon" rights, as told to us by Sally Robson (sally.robson@faber.co.uk)
who suggested we ask
A P Watt Ltd.
2. A. P. Watt does not hold the rights of the book, as
told to us by Melanine Rigg, apw@apwatt.co.uk)
3. The editor of the book Our Moon, Frederick Muller
Ltd, London, is no more active following 1985.