

| Weather Data | |||
|---|---|---|---|
| ULTIMO RILEVAMENTO ALLE ORE: 12:34 GIORNO: 17 Maggio 2013 prossimo aggiornamento ore: 00:00 | |||
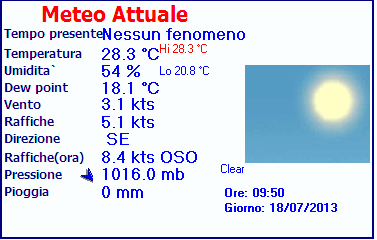
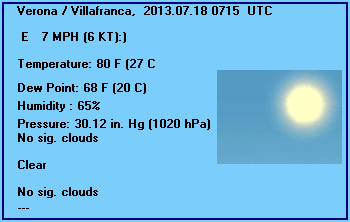
| Tempo presente | Nessun fenomeno | Temperatura attuale | 16.8°C (62.2°F), temperatura apparente 18.4°C, Apparent temp solar 21.0°C |
| Temperatura massima (da mezzanotte) | 16.8°C alle ore: 12:00 | Temperatura minima (da mezzanotte) | 14.3°C alle ore: 10:06 |
| Forza media vento (dieci minuti) | 1.4 kts (2.5 kmh) | Direzione vento (dieci minuti) | NNE (25°) |
| Temperatura vento | 16.8°C | Massima forza (ultima ora) | 7.6 kts (14.1 kmh) alle ore: 11:35 |
| Massima forza (da mezzanotte) | 18.3 kts (33.9 kmh) alle ore: 07:46 | Massimo vento 1 minuto (da mezzanotte) | 13.2 kts (24.4 kmh) alle ore: 07:46 |
| Pioggia (ultima ora) | 0.0 mm | Pioggia (da mezzanotte) | 10.7 mm (0.42 in.) at 10:07 |
| Pioggia Questo mese | 175.8 mm (6.92 in.) | Pioggia Questo anno | 337.0 mm (13.27 in.) |
| Massima pioggia per minuto (ultima ora) | 0.0 mm/min | Massima pioggia per ora (ultime 6 ore) | 6.4 mm/ore |
| Pioggia di ieri | 61.3 mm | DewPoint | 16.2°C (Wet Bulb :16.4°C ) |
| Umidita | 96 %, Humidex 21.5°C | Pressione S.L.M. | 999.0 mb |
| Variazione pressione | +1.0 mb (ultima ora) | Tendenza (ultime 1 ore) | Aumento slowly |
| Variazione pressione (ultime 12 ore) | +2.0 mb | Variazione pressione (ultime 6 ore) | +4.0 mb |
| Current Interna temp. 23.2°C | |||
| Current Interna hum 46% | |||
| Current solar | 55 W/Mē | Current UV | 0.0 |
| Maximum solar (da mezzanotte) | 76 W/Mē | Maximum UV (da mezzanotte) | -1.0 |
| Current 00:00 hours of sunshine today, current sky: | |||
| Sunshine hours for the year: | 00:00 hrs | Sunshine hours for the month: | 00:00 hrs |
| Current evapotranspiration rate 0.5 mm per day. Yesterday's reading 1.1 | |||


Use the RELOAD facility on your browser to retrieve the latest data.