
Tracker 3D
| Visual SAT-Flare Tracker 3D |
SITE MAP DAYLY
PREDICTIONS NEED
INFORMATION? GET IN TOUCH
НАПИШИ МНЕ
|
IRIDIUM 33 POST COLLISION MODELS Post-Collision Rotating IRIDIUM 33 Model and "Flare" Predictions - 21/03/2009 As I reported on SeeSat (here) a few days ago, despite the collision with the Cosmos 2251, the satellite Iridium 33 is not completely destroyed as many have thought, since bright "flares" can be still observed on occasion: during my first observation I got two series of "flares" in the negative magnitude range. The first series was in the south-west part of my local sky, while the second series in the north-west part. This made me immediately thinking that at least two of its Main Mission Antennas might be still intact, or however, able to provide bright flashes. Since my first observation, I kept on tracking the satellite during the next passes collecting times of the flashes that were brighter than sirius. By using the gathered data I tried to model the satellite rotation (which takes about 4.6 seconds). The first results, however, showed that the two series of observed flashes were not related to two different mirrors, but instead, generated by the same rotating antenna. This let me collect two flashing angles during the same pass, and therefore, speed-up the modeling process; by using data collected during two consecutive passes (within about 1.5 hours) I estimated the rotation axis of the satellite neglecting the axis precession. Furthermore, I added into my program the functions necessary to deal with rotating satellites and this allowed me to provide approximate "flare" predictions also for other locations. Predicted "flares" have been successfully observed in Netherlands (read report), Spain (read report), and USA where they have been also recorded (view details and video). So far, the time deviations between predictions and observations have been less than 1 minute. But, after a recent adjustment deviations less than half a minute have been obtained. The following 3D picture depicts the flare generated by the rotating MMA of the Iridium 33 during a pass over Spain: the flare cone generates a "U"-shaped ground track (something between a "U" and a "V") opposite to the sun position (at this latitude). 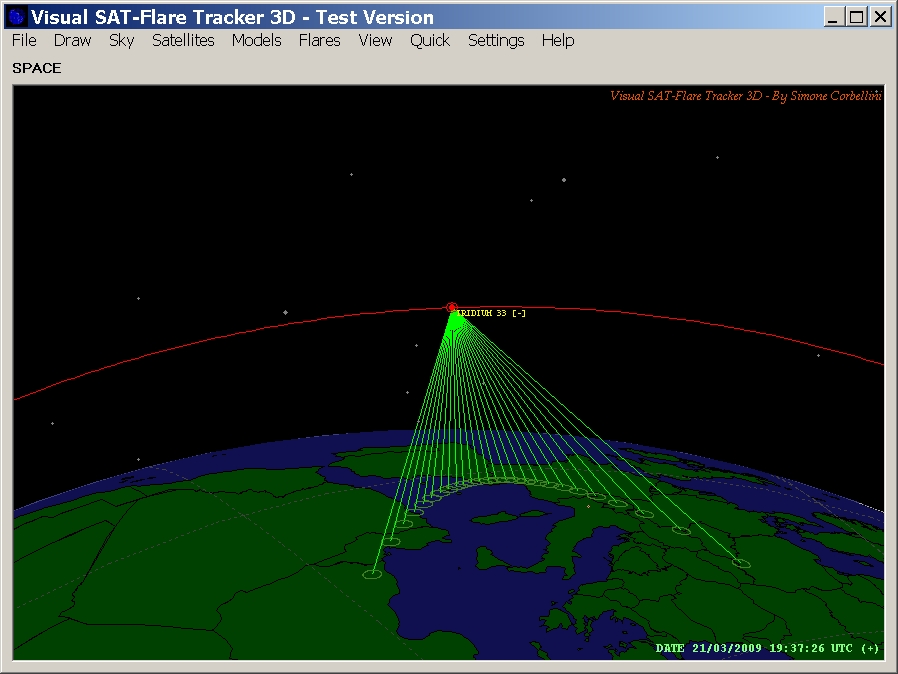 Observations confirmed my rough model also during a pass where I was just along the base of the "U". During that occasion many sequential and spectacular bright "flares" were visible for a longer time. I have estimated the apparent satellite rotation time to be 4.63 ± 0.03 seconds. Thanks to this rather fast rotation, bright flashes, around magnitude -3, can be seen by all the observers along the flare track. However, if the rotating antenna reflects the sun light at the right time, even brighter "flares" can be seen. I suppose up to about magnitude -7 as for an intact antenna (however, the short "flare" duration may make it difficult to perceive the real brightness). The following screenshot shows the rotating flare track for a different satellite position. 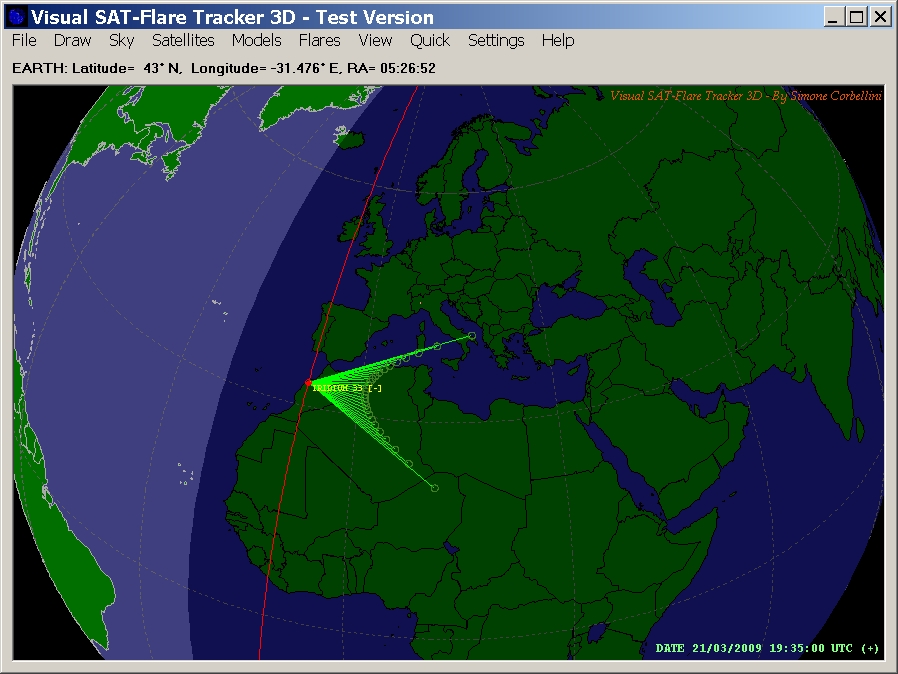 Where flashes should be visible The following pictures show the region of the sky where the flashes should be visible (for three different latitudes: 45° N, 0°, -45° N, up to the end of the March). Flashes are visible in the west part of the local sky (from the red line toward the right side of the pictures). When the satellite pass is close to the red line the two flashes are close each other and to the zenith. When the satellite elevation is low, the first flash moves toward south while the second one toward north. "Flares" are easily visible naked eye but their duration is of only about 0.1 - 0.2 seconds. Unfortunately, visible "flares" will soon disappear because of the orbit movement toward the terminator. 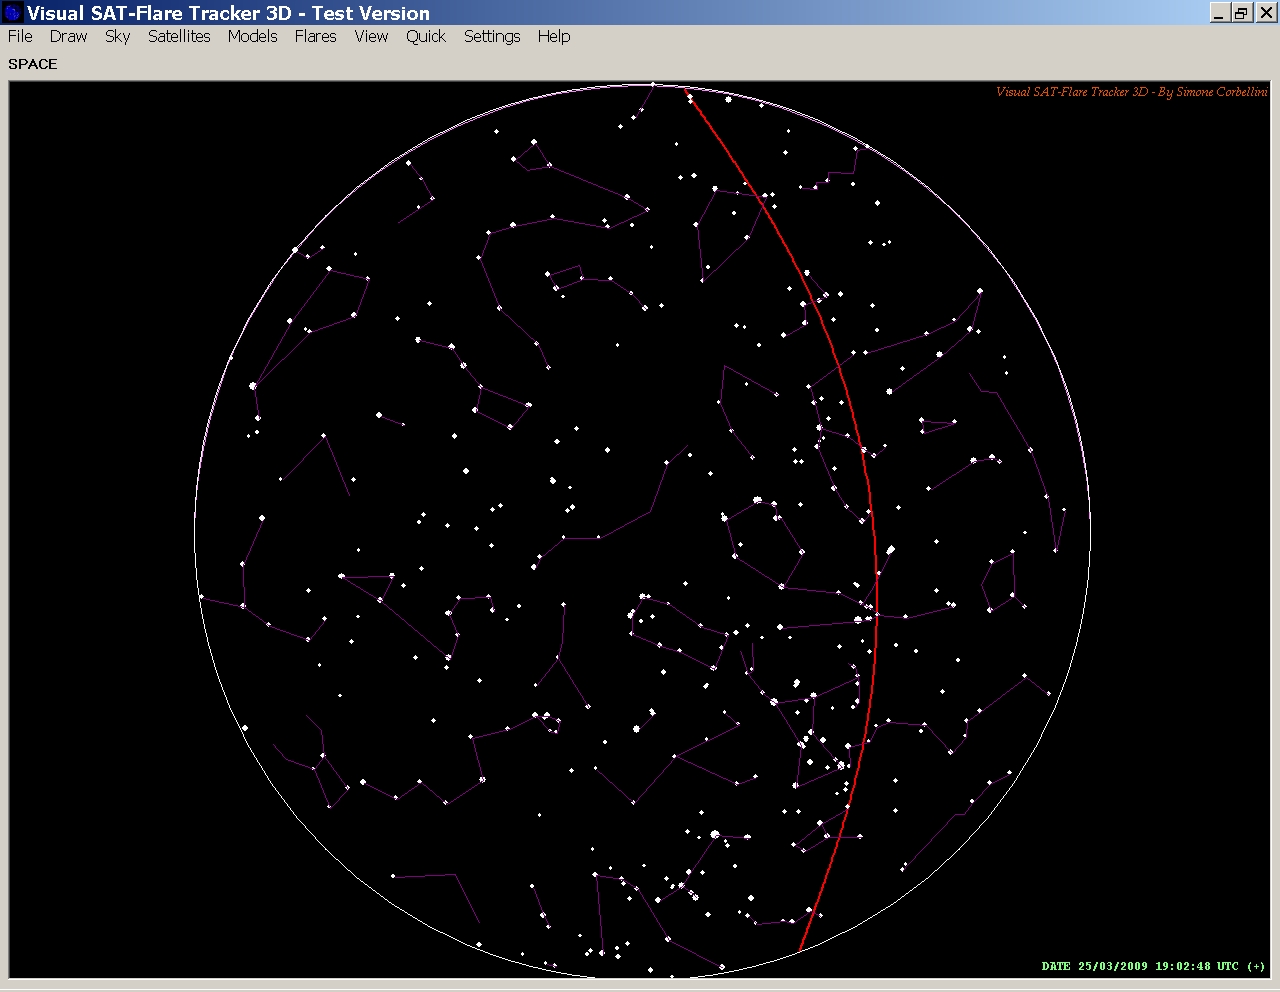 Visibility limit for latitude 45° N. 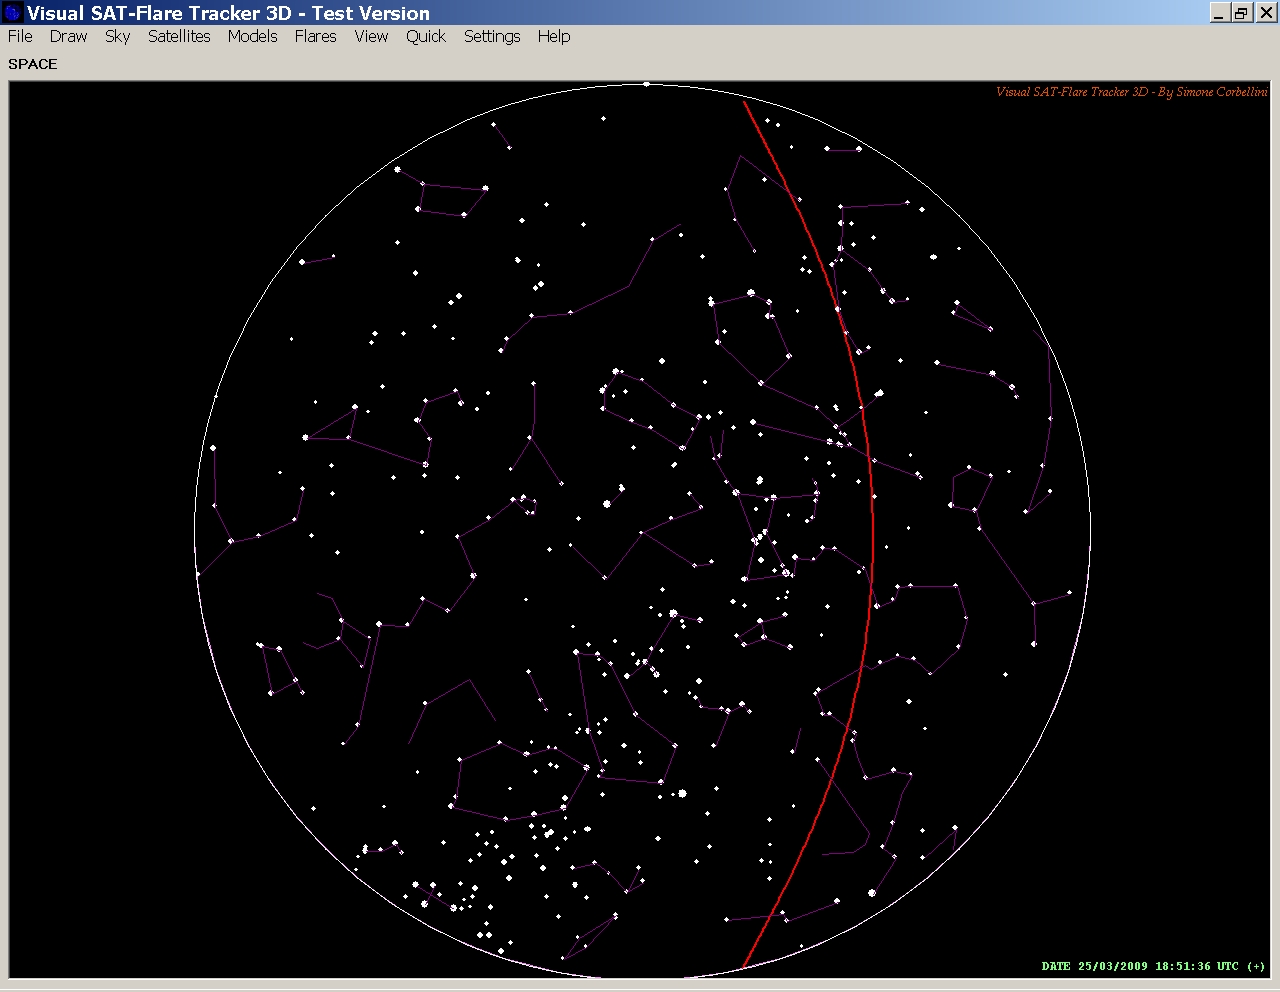 Visibility limit for latitude 0°. 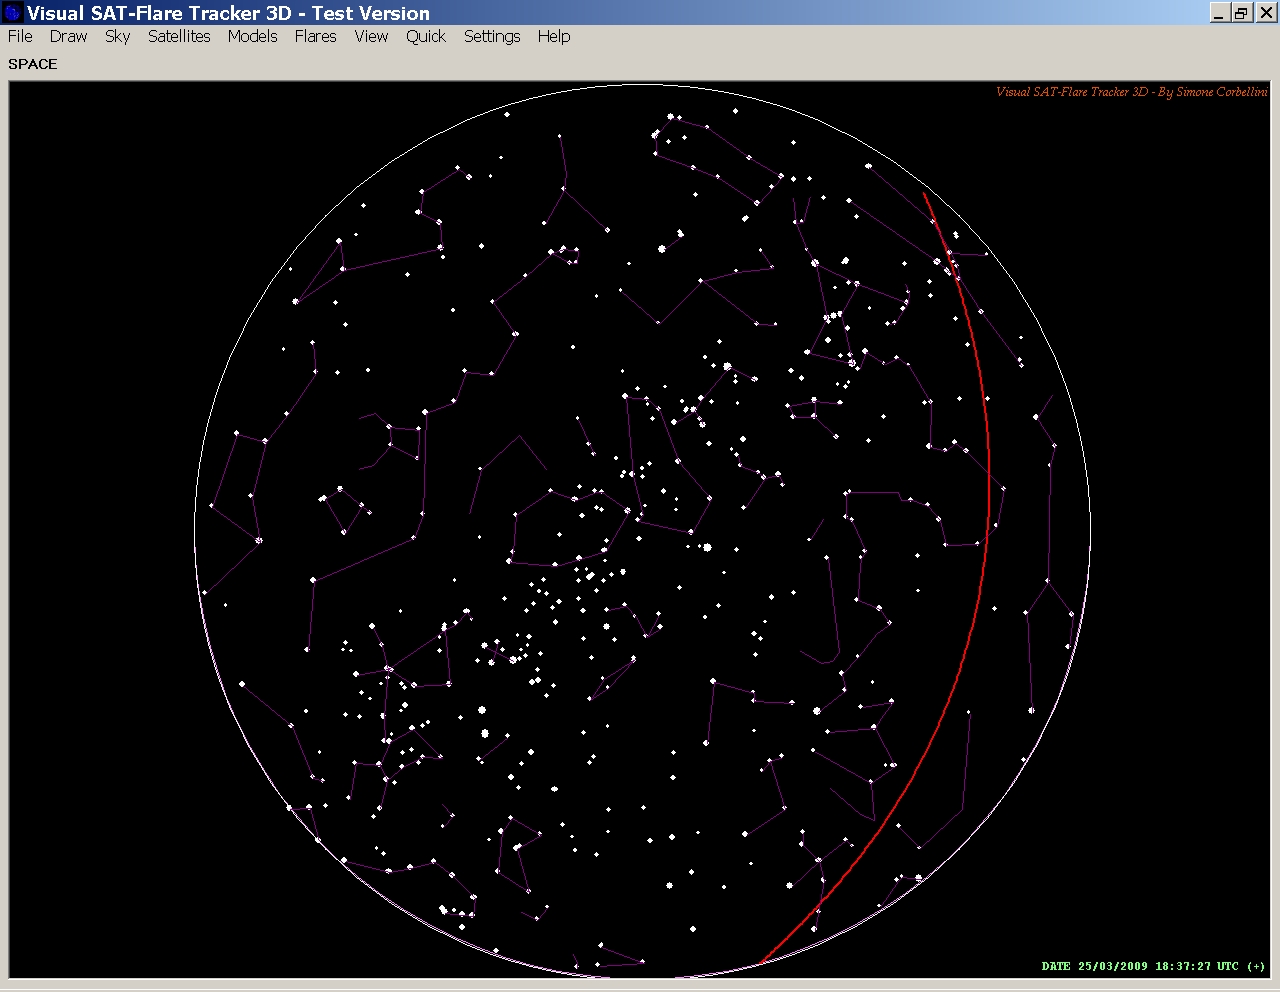 Visibility limit for latitude -45° N. By Simone Corbellini |
|