
Tracker 3D
|
Visual SAT-Flare Tracker 3D |
| By Simone Corbellini | 13 January 2011 |
Observing The Iridium Flares From The
ISS
Iridium flares can be easily
observed from all around the globe especially with the help of
any of the available satellite tracking programs, which can be employed to
predict when these events
occur for a given location of the planet. Looking at the
wonderful photographs recently taken from the International Space
Station (ISS), I started wondering if such flares could be observed
from
the ISS as well. At least teoretically, would it be possible to take a
photograph of an Iridium flare from the International Space Station?
Well, I think the answer is yes!
Despite it is reasonable that flares can be visible from the Station, one might think that such events are too short to be easily observed and photographed. In addition, it is not so obvious how often these events can take place. To investigate this unusual observing place, and to generate 3D representations of what it would be visible, I modified my program to include the possibility to place the observer aboard the station and to account for its fast movement along the orbit. The speed of the Iridium satellites with respect to an observer on the Earth is of about 7.5 km/s; this value is almost completely due to the satellite speed along its orbit (the Earth rotation is negligible), however, when the observer as well is orbiting with the Station, the apparent speed can be very different and the Station speed, which is of about 7.7 km/s, has to be taken into account. In most of the cases this results in a satellite apparent speed that is higher than the one usually perceived on the ground and, therefore, it results in shorter flares. However, there may be cases where the two satellites move approximately in the same direction and this leads to lower apparent speeds generating even much more long flares. This considerations suggest also that, at least for these last kind of events, a more accurate knowledge of the two orbital elements is not required to predict flares for observers on the ISS (i.e. if the flare lasts longer, a little delay of the satellite/station is not so critical). Another aspect that has to be considered is the distance between the Iridium satellite and the observer. For a classical observation on the ground the minimum distance is determined by the satellite "altitude", which is of about 780 km, while the maximum distance is determinated by the visibility area of the satellite (or visibility circle), which again depends on the orbit "altitude". For the Station the situation is quite different: the minimum distance corresponds to the difference in the orbit altitudes, while the maximum distance is approximately the sum of the radius of the two visibility circles. The minimum distance can be as low as about 430 km (the ISS orbit altitude is of about 350 km) and this also means that flares can be brighter than those usually visible from the ground (but also much more short since the angular speed inversely depends on the distance). The following picture (Fig 1) depicts a flare that could have been observed on the ISS on the 24 of December 2010. The flare was generated by the Iridium 46 while the Station was in Earth shadow (night) above Spain at about 20.06 UTC. The two visibility circles intersect each other and this means that the Iridium 46 was actually visible above the "local horizon" of the observers aboard the ISS. 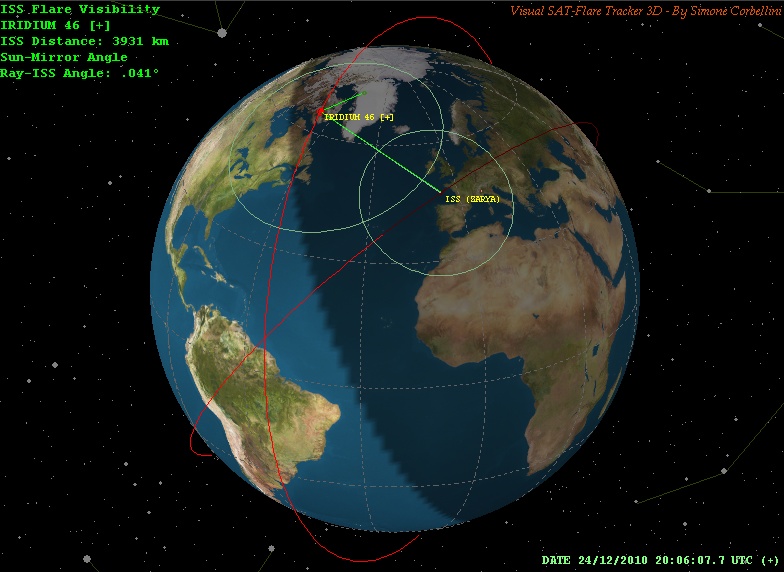 Fig.
1 - 3D Picture of the Iridium 46 flare that could have been
observed from the ISS on the 24 of December.
The distance between the ISS and the Iridium satellite was of about 4000 km. The Fig. 2 proposes another view
of the same flare from which it is possible to see that while
the reflection generated by one of the satellite Main Mission
Antenna (MMA) hits the ground, generating a visible ground
flare, another antenna generates the reflection that hits the
International Space Station.
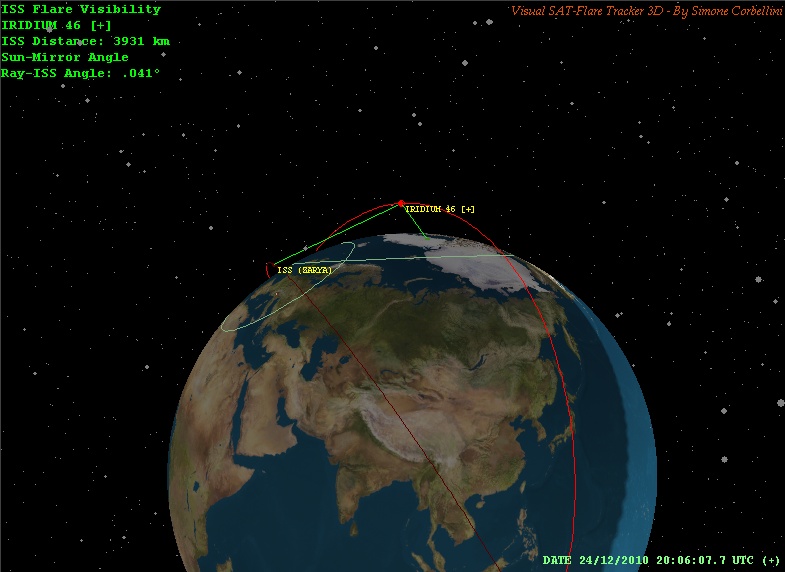 Fig.
2 - Another 3D picture of the Iridium 46 flare on the 24 of December.
While one Main Mission Antenna (MMA)
generates one reflection that is projected on the ground, a second antenna generates the reflection that intercepts the International Space Station around 20.06.08 UTC. How and where would it appear this flare from the International Space Station? To answer this question I have generated a 3D picture which shows Earth, stars and the flaring satellite as it should have appeared from the Station. The Fig. 3 shows the results; the satellite should have been visible in Hercules a few degrees above the "local horizon" in the centre of the picture and on the left of the UK and Ireland, which are well highlighted by the night lights. 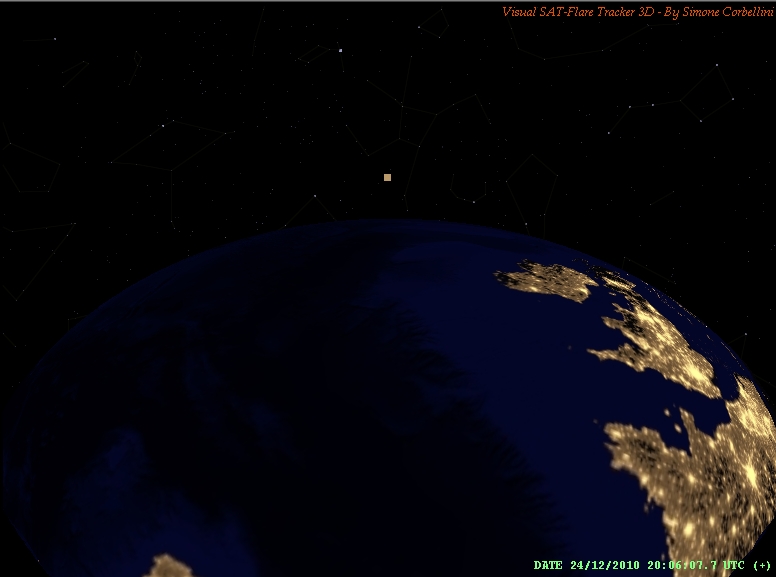 Fig.
3 - 3D Picture that depicts what should have been visible looking at
the flaring satellite from the ISS.
The flaring satellite is visible in Hercules just a few degrees above the horizon. To provide a better view, a stereo pair of images has been created as well and reported in Fig 4. (This picture can be seen crossing the eyes at about half a meter from the screen). A 3D simulated video of the flare has been generated as well and can be started by clicking on the next picture. More details on how stereo pictures can be seen are available here: http://www.starosta.com/3dshowcase/ihelp.html 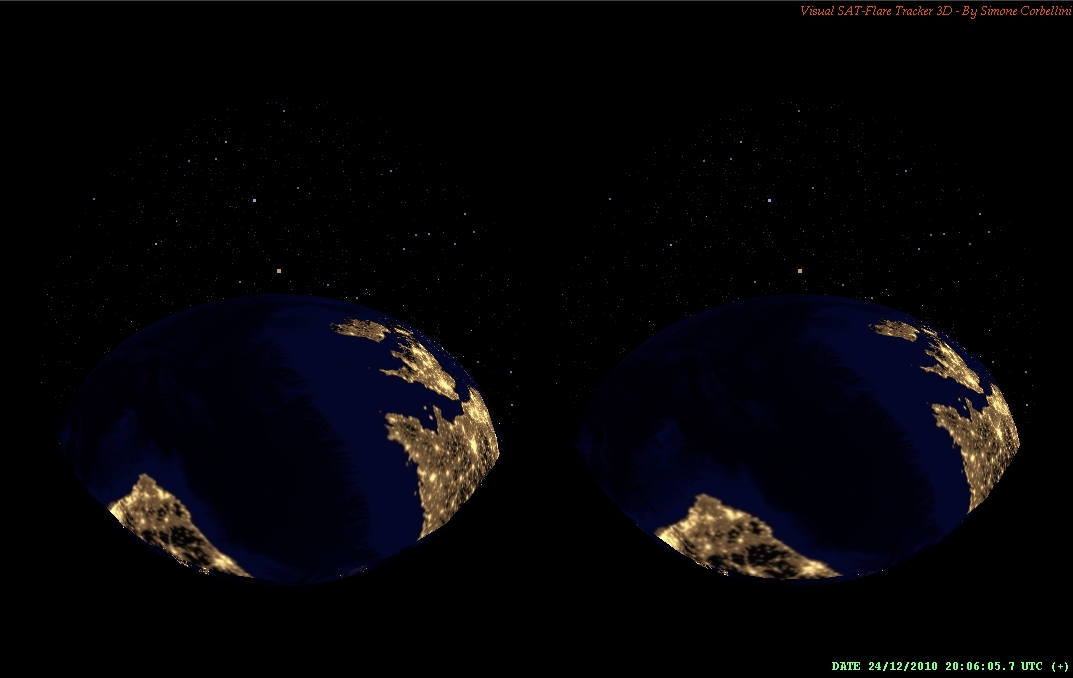 Fig.
4 - 3D Stereo Picture of the flaring satellite, stars and the Earth as
it should have appeared from the ISS.
Other Iridium satellites are included in the scene. The number of visible flares
basically depends on the precession of the ISS orbit and
on its actual orbital period, which can lead to
have many visible flares per day or even none. Under
particular configurations flares can even occur periodically; in some
simulations periodic flares, at intervals of about one hour and 32
minutes,
have been observed for many hours. The following table
reports, as an example, the flares with negative magnitude for the 11 and
12 of January.
TABLE A -
Flares for the day 11 and 12 of January.
Predictions of
Iridium Flares Visible from the
ISS
Two interesting flares can be
predicted for the
following hours: the maximum of the first one should occur on the 15th
of
January 2011 at 00.38.30 UTC, when the predicted angle between the
reflected ray and the satellite-observer line will be of only 0.02°.
The expected magnitude
is of -4.7. Despite
the low angle value, the
flare magnitude is limited by the satellite distance, which will be of
about 3000 km, and by the large mirror angle, which will be
of 72°, that greatly reduces the apparent reflective surface of the
antenna. However, the two satellites will both move toward the southern
pole
leading to a very long flare: about 8 seconds after the time of the flare
maximum
the predicted magnitude is still of about -2. Table I reports
more magnitude values around the time of the maximum.
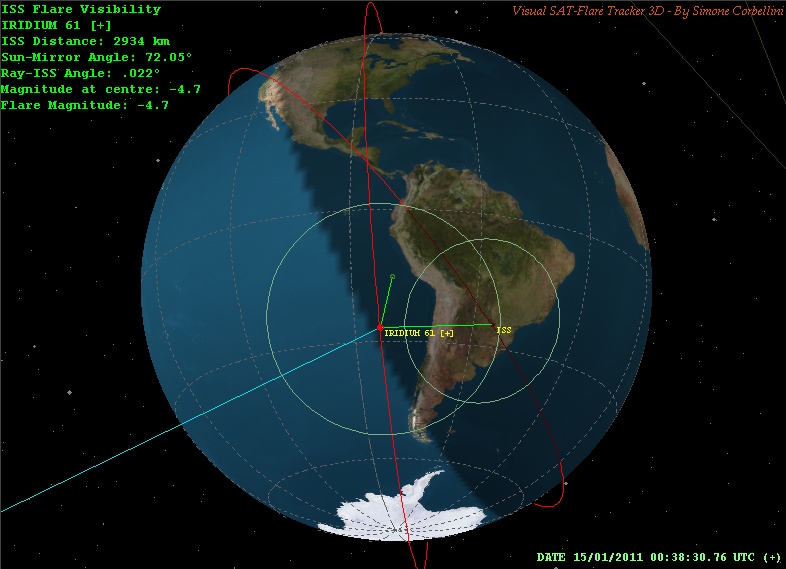 Fig.
5 - 3D Picture that depicts the Iridium 61 flare that will be visible
on the ISS at the 00.38.30 UTC on
the 15th of January 2011. The maximum magnitude of the flare should be of about -4.7. The flare should last longer than usual ground flares and its magnitude should still be of about -2 even 8 seconds after the maximum.
TABLE
I -
Flare magnitude around the time of the maximum.
From an observer aboard the Station the flaring satellite will appear in Aquarius a few degrees above the local horizon just when the ISS will be above Paraguay. The following 3D simulation depicts what should be visible from the ISS (Fig. 6). 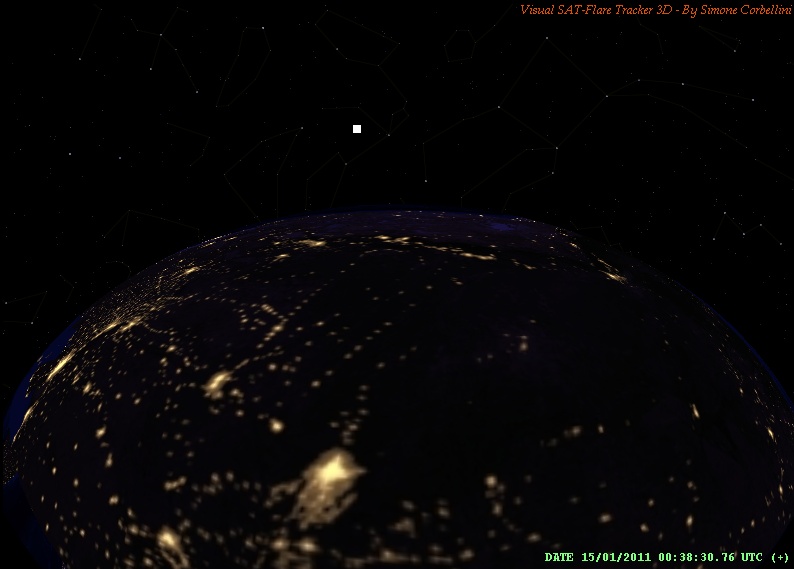 Fig.
6 - 3D Picture that shows how it will appear the Iridium 61 flare
from the ISS. The satellite will be flaring
from Aquarius. Another
interesting flare should
occur only about 2 hours later, at about 02.20.13 UTC on the 15th of
January 2011, when the ISS will intercept the reflection while
passing
under the Iridium 98 orbit. In this case, the distance between the two
satellites will be of only 500 km, leading to an extremely bright flare
with a maximum magnitude of -9.7. The flare will not
last for long, as shown by the Table II that reports the
predicted magnitude around the time of the maximum (due to the small
distance of the satellites the actual maximum magnitude might change
when new orbital elements will be available). Despite the two
satellites will be close each other, only the ISS will be in
Earth shadow thanks to its lower orbit. In this case, for a ground
observer, the ISS will intercept the reflection directed toward the
ground eclipsing the flare for a while.
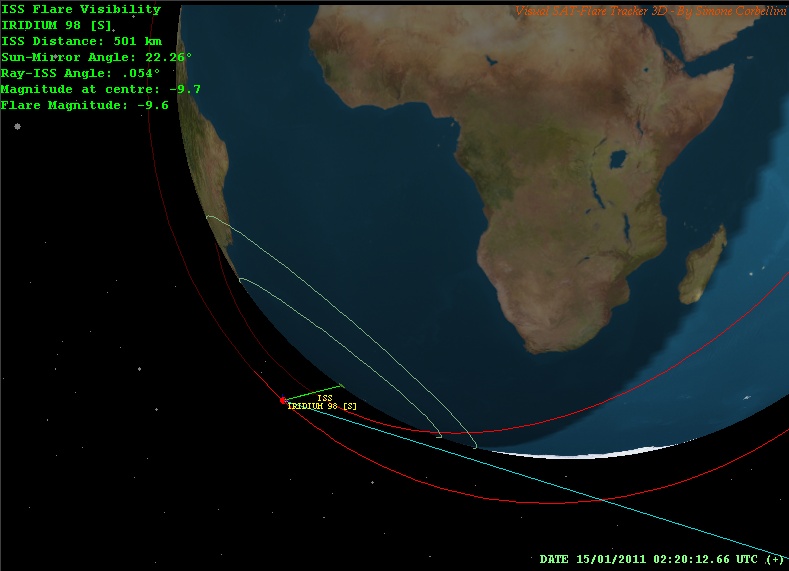 Fig.
7 - 3D Picture of the Iridium 98 flare that can be observed from the
ISS.
The Station will intercept the reflected ray directed toward the ground.
TABLE
II -
Flare magnitude around the time of the maximum.
Observing from the ISS,
the satellite should appear flaring close to k Ori in Orion.
The following picture (Fig. 8) shows what should be
visible from the ISS looking toward the satellite.
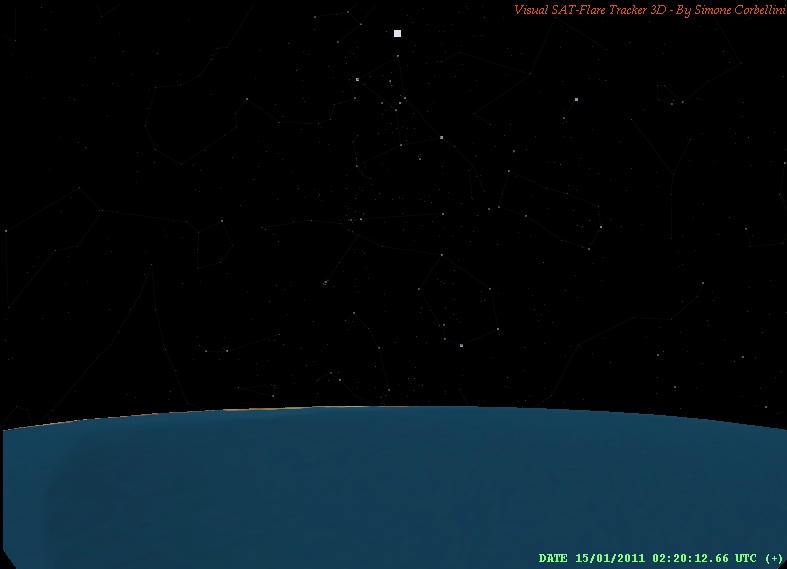 Fig.
8 - 3D Picture that shows how it will appear the Iridium 98 flare
from the ISS.
The satellite will be flaring when close to k Ori in Orion. Other predictions for the period from the 14 January to the 21 January are reported in Table III. The Mirror Angular Speed
value indicates how fast the flares will be. As an example, the
previous flares have speeds of 0.01 deg/s (Iridium 61 flare)
and 0.045 deg/s (Iridium 98 flare). It is interesting to note that the
same Iridium satellite can flare more than once within a few days
(see Iridium 37).
TABLE III - Predictions of Iridium flares with negative magnitude visible from the ISS from the 14 of January to the 21 of January. (Last update 14 Jan - 11.30 UTC). |
|||||||||||||||||||||||||||||||||||||||||||||||||||||||||||||||||||||||||||||